Associations of plasma biomarkers with cerebral perfusion and structure in Alzheimer’s disease
- Select a language for the TTS:
- UK English Female
- UK English Male
- US English Female
- US English Male
- Australian Female
- Australian Male
- Language selected: (auto detect) - EN
Play all audios:

Plasma biomarkers have great potential in the screening, diagnosis, and monitoring of Alzheimer’s disease (AD). However, findings on their associations with cerebral perfusion and structural
changes are inconclusive. We examined both cross-sectional and longitudinal associations between plasma biomarkers and cerebral blood flow (CBF), gray matter (GM) volume, and white matter
(WM) integrity. Forty-eight AD patients whose diagnosis was supported by amyloid-β (Aβ) PET received measurement of plasma biomarkers with a single molecular array, including Aβ42,
phosphorylated tau 181 (P-tau181), neurofilament light (NfL), total tau (T-tau), and glial fibrillary acidic protein (GFAP), and both baseline and one-year follow-up magnetic resonance
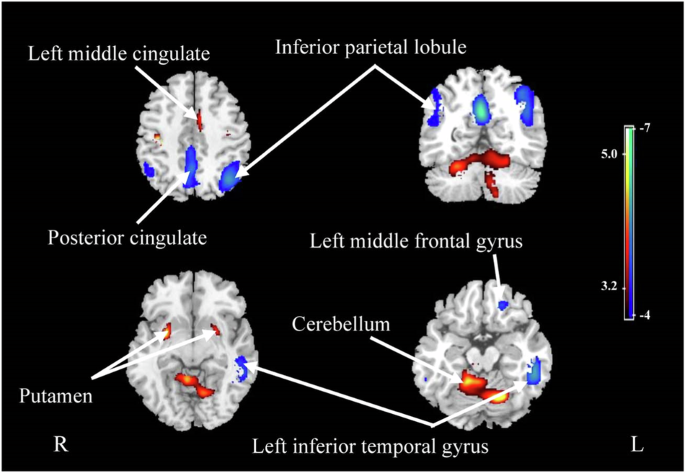
imaging, including pseudo-continuous arterial spin labeling, T1-weighted imaging, and diffusion tensor imaging. Correlations were found between regional CBF and several plasma biomarkers,
with Aβ42 showing the strongest correlation with CBF in the left inferior temporal gyrus (r = 0.507, p = 0.001). Plasma P-tau181 and GFAP levels were correlated with GM volume in the
posterior cingulate gyrus and the bilateral hippocampus and right middle temporal gyrus, respectively. Decreased CBF and GM volume in regions vulnerable to AD, such as the posterior
cingulate gyrus, inferior parietal lobule and hippocampus, could be predicted by the levels of specific plasma biomarkers. Most biomarkers, except Aβ42, showed extensive correlations with
longitudinal WM disruption. Plasma biomarkers exhibited varied correlations with brain perfusion, GM volume, and WM integrity and predicted their longitudinal changes in AD patients,
suggesting their potential to reflect functional and structural changes and to monitor pathophysiological progression in the brain.
Currently, the diagnosis of Alzheimer’s disease (AD) is based on clinical presentations and postmortem confirmation but can also be made in vivo with the presence of abnormal biomarkers [1].
Although cerebrospinal fluid (CSF) and positron emission tomography (PET) biomarkers have largely increased diagnostic accuracy, they are either invasive or expensive to identify. With the
development of ultrasensitive immunoassays and mass spectrometry techniques, biomarkers can be identified in peripheral blood with great performance. Blood-based biomarkers are easily
accessible, cost- and time-effective, less invasive, and can be serially measured, which suggests new possibilities in the screening, diagnosis, and monitoring of AD [2].
Recent studies have identified and validated plasma biomarkers reflecting pathological processes involved in the occurrence and progression of AD, including amyloid-β (Aβ) deposition (Aβ42
and Aβ42/40), pathological tau [phosphorylated tau (P-tau)], neurodegeneration [neurofilament light (NfL) and total tau (T-tau)], and neuroinflammation [glial fibrillary acidic protein
(GFAP)], as the ATNI profile [3, 4]. Given the promising application of these plasma biomarkers in clinical practice and trials, it is important to clarify their correlations with various
pathophysiological mechanisms, such as functional and structural changes in the brain, in addition to their diagnostic value in AD.
Several studies have cross-sectionally and longitudinally observed correlations between gray matter (GM) atrophy and the levels of plasma biomarkers, such as P-tau181, NfL, T-tau, and GFAP
[5,6,7,8], although the results were not comparable or were inconsistent between different testing platforms. Apart from brain volume reduction, white matter (WM) disruption and decreased
cerebral blood flow (CBF) have been found to be evident even at early stages of AD [9,10,11,12,13] and could be direct causes of cognitive impairment [14,15,16,17]. Plasma biomarkers, such
as P-tau181, NfL, and GFAP, have been reported to be correlated with WM integrity in AD patients [18,19,20]. However, whether plasma biomarkers can reflect CBF changes in AD patients has not
been investigated. Aβ and tau depositions can be accelerated by cerebral hypoperfusion, and in turn, the neurotoxic Aβ and tau further exacerbate cerebral hypoperfusion [21,22,23,24].
Therefore, although a few studies have reported associations between specific plasma biomarkers and GM and WM changes, a comprehensive understanding of how ATNI plasma biomarkers can reflect
functional and structural brain changes, particularly perfusion, is lacking. In this study, we analyzed the plasma levels of Aβ42, P-tau181, NfL, T-tau, and GFAP and their correlations with
cross-sectional and longitudinal changes in CBF, GM volume, and WM integrity measured with magnetic resonance imaging (MRI) in AD patients whose diagnosis was supported by amyloid PET.
A total of 72 participants (48 AD patients and 24 cognitively unimpaired controls) were recruited from Tianjin Medical University General Hospital. This was an exploratory study. Empirical
and feasibility considerations determined the number of enrolled participants. No formal statistical estimation of sample size was performed. All participants provided written informed
consent. The diagnosis of AD was based on the research criteria for typical AD of the International Working Group‐2 (IWG‐2) [25]. The inclusion criteria for AD patients were as follows: (1)
aged 50–85 years; (2) had early and prominent episodic memory impairment; (3) had a Clinical Dementia Rating (CDR) [26] score of 0.5–2; (4) had a positive result on 11C-Pittsburgh Compound B
(PiB) PET; and (5) had no evidence of clinically significant cerebrovascular lesions on MRI. Patients whose cognitive impairment was potentially caused by other neurological diseases,
mental disorders or medical conditions, such as frontotemporal lobar degeneration, Parkinson’s disease dementia or dementia with Lewy bodies, multiple sclerosis, severe depression, alcohol
or drug abuse, vitamin B12 deficiency, or human immunodeficiency virus (HIV) or syphilis infection, were excluded. The inclusion criteria for the cognitively unimpaired (CU) controls were as
follows: (1) aged 50–85 years; (2) no subjective cognitive decline complaints and normal performance in each cognitive domain of objective neuropsychological tests; (3) a CDR score of 0 and
a Mini-Mental State Examination (MMSE) [27] score no less than 24; and (4) no clinically significant brain atrophy or cerebrovascular lesions on MRI. Plasma biomarkers and both concurrent
and one-year follow-up neuroimaging data were collected for all participants.
Blood samples were collected in EDTA tubes in the morning. The samples were centrifuged at 2500 × g and 4 °C for 35 min to obtain plasma within 2 h of collection. The plasma samples were
stored at −80 °C for future analysis. Plasma biomarkers were measured using single molecular array technology with an ultrahigh-sensitivity protein molecular detection instrument (Simoa
HD-1, Quanterix, MA, USA). Plasma Aβ42 and T-tau levels were measured using a Neurology 3-Plex A assay kit (Quanterix, 503203), NfL, and GFAP levels were measured using a Neurology 2-Plex B
assay kit (Quanterix, 502713), and P-tau181 levels were measured using a P-tau181 V2 assay kit (Quanterix 503008) according to the manufacturer’s instructions.
MRI was performed on a 3.0-Tesla scanner (Discovery MR750, General Electric, Milwaukee, WI) with a 64-channel phased array head coil. T1 images were obtained using a brain volume (BRAVO)
sequence with the following parameters: echo time (TE)/repetition time (TR) = 3.18/8.16 ms, inversion time (TI) = 450 ms, field of view (FOV) = 256 × 256 mm, matrix = 256 × 256, flip angle
(FA) = 12°, slice thickness = 1 mm, and 188 slices. The 3D pseudo-continuous arterial spin labeling (ASL) series was acquired using a spiral spin‒echo sequence and background suppression
with the following parameters: TE/TR = 11.1/5046 ms, labeling duration = 1450 ms, post-labeling delay (PLD) = 2025 ms, FA = 111°, matrix size = 128 × 128, FOV = 240 × 240 mm, arms = 8,
acquisition points = 512, slice thickness = 3 mm, and 50 slices. Diffusion MRI was acquired using a diffusion-weighted spin‒echo single shot echo planar imaging (EPI) sequence with the
following parameters: TE/TR = 63.2/6000 ms, FA = 90°, FOV = 256 × 256 mm, matrix size = 128 × 128, slice thickness = 6 mm, 50 slices, and 64 diffusion directions (b = 1000 s/mm2).
ASL MRI images were automatically converted into CBF maps using Functool software (version 9.4, GE Medical Systems) on an Advantage Windows workstation. Image processing was conducted using
voxel-based analysis in SPM12 (https://www.fil.ion.ucl.ac.uk/spm/software/spm12) with the following steps: (1) the CBF images were registered to structural MRI images; (2) the structural
images were normalized to the Montreal Neurological Institute (MNI) space and segmented into GM, WM and CSF; (3) using the parameters determined from the structural images, the CBF images
were normalized and multiplied by a binary brain tissue mask consisting of only GM and WM; and (4) the normalized CBF maps were then smoothed with a full width at half maximum (FWHM) of 10
mm. We performed a quality check via visual inspection at every preprocessing stage. The differences in CBF between AD patients and CU controls were analyzed using two-sample t tests with
age and sex as covariates. Several clusters were identified after adjusting for global values with an analysis of covariance (ANCOVA) (voxelwise threshold p