Phosphoproteomics reveals rewiring of the insulin signaling network and multi-nodal defects in insulin resistance
- Select a language for the TTS:
- UK English Female
- UK English Male
- US English Female
- US English Male
- Australian Female
- Australian Male
- Language selected: (auto detect) - EN
Play all audios:

The failure of metabolic tissues to appropriately respond to insulin (“insulin resistance”) is an early marker in the pathogenesis of type 2 diabetes. Protein phosphorylation is central to
the adipocyte insulin response, but how adipocyte signaling networks are dysregulated upon insulin resistance is unknown. Here we employ phosphoproteomics to delineate insulin signal
transduction in adipocyte cells and adipose tissue. Across a range of insults causing insulin resistance, we observe a marked rewiring of the insulin signaling network. This includes both
attenuated insulin-responsive phosphorylation, and the emergence of phosphorylation uniquely insulin-regulated in insulin resistance. Identifying dysregulated phosphosites common to multiple
insults reveals subnetworks containing non-canonical regulators of insulin action, such as MARK2/3, and causal drivers of insulin resistance. The presence of several bona fide GSK3
substrates among these phosphosites led us to establish a pipeline for identifying context-specific kinase substrates, revealing widespread dysregulation of GSK3 signaling. Pharmacological
inhibition of GSK3 partially reverses insulin resistance in cells and tissue explants. These data highlight that insulin resistance is a multi-nodal signaling defect that includes
dysregulated MARK2/3 and GSK3 activity.
Insulin resistance is a key defect preceding type 2 diabetes, cardiovascular disease, and other metabolic diseases1. Impaired insulin-stimulated translocation of the glucose transporter
GLUT4 to the cell surface is one of the primary defects resulting from insulin resistance in muscle and adipose tissue, leading to decreased insulin-stimulated glucose uptake1. Adipose
tissue insulin resistance precedes muscle insulin resistance during high-fat feeding2,3, and adipose-specific abrogation of insulin action leads to systemic insulin resistance4,5. Hence,
there is considerable interest in studying adipose insulin action to understand how this tissue contributes to whole-body insulin resistance. Reversible protein phosphorylation is an
essential post-translational modification mediating insulin action, making signal transduction a focal point for mechanistic understanding of this metabolic process6.
Adipose insulin resistance has been linked to external stressors including chronic inflammation7, hyperinsulinemia8, glucocorticoids9, and lipotoxicity10,11, as well as associated internal
stressors such as mitochondrial dysfunction12, oxidative stress13, and endoplasmic reticulum stress14. These stressors have been suggested to impair early steps in the insulin signaling
cascade, thereby attenuating insulin-stimulated GLUT4 translocation. Indeed, several protein kinases activated by these insults, including mTORC1, S6K, Jnk and PKC, have been reported to
phosphorylate and inhibit the insulin receptor or its scaffold protein IRS (reviewed in15). However, we and others have recently called this hypothesis into question1,5,16, and the causal
relationship between changes in early insulin signaling and the downstream actions of insulin remains unclear, especially in the context of insulin resistance. There is therefore an urgent
need for global unbiased analyses of signaling in insulin-resistant cells to pinpoint potential alterations contributing to insulin resistance.
Mass spectrometry (MS)-based phosphoproteomics now makes it possible to study insulin signaling on a global scale17,18,19. Here, we employed recent advances in the throughput and sensitivity
of these technologies20,21 to analyze acute signaling responses to insulin in the context of adipose insulin resistance. We initially focused on the highly insulin-responsive 3T3-L1
adipocyte cell line allowing us to study signaling defects in isolation from the complex milieu of whole organisms, and subsequently validated key findings in mouse adipose tissue. In
particular, we exposed cells to five insults spanning a broad range of factors known to contribute to adipocyte insulin resistance, reasoning that signaling changes induced by multiple
insults would be more likely to contribute to the etiology of insulin resistance.
Our global phosphoproteomic analyses reveal that insulin resistance is accompanied by extensive rewiring of the insulin signaling network, which is largely exclusive of canonically studied
insulin signaling nodes. A diverse subnetwork of kinases, proteins, and pathways were dysregulated across multiple models, prompting us to further investigate MARK2 and MARK3 as regulators
of insulin action. Using a small molecule inhibitor together with phosphoproteomics and motif analysis we generated a resource of adipocyte-specific substrates for the kinase GSK3. This
approach facilitated the identification of defective GSK3 signalling across all cell models, and in insulin-resistant adipose tissue. Studies in cells and tissues using multiple GSK3
inhibitors established that acute GSK3 inhibition partially restored insulin sensitivity, supporting these findings. Thus, our data provide a quantitative atlas delineating the signaling
dysregulation in adipocytes during insulin resistance and can be navigated at www.adipocyteatlas.org.
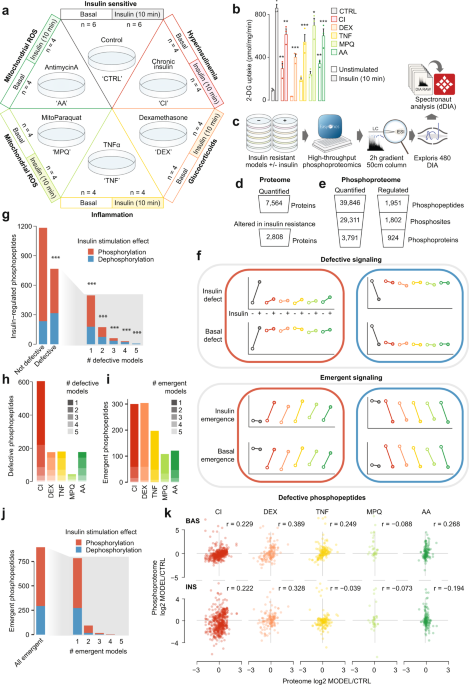
We selected five distinct models of insulin resistance in 3T3-L1 adipocytes, enabling us to pinpoint molecular rearrangements specific to insulin resistance rather than unrelated effects of
the insults that cause it. These included three well-characterized models mimicking systemic insults reported to induce insulin resistance in humans and animals: hyperinsulinemia (chronic
insulin treatment, CI), glucocorticoids (dexamethasone treatment, DEX) and inflammation (TNFα treatment, TNF) (Fig. 1a)3. Mitochondrial oxidants have recently been implicated in insulin
resistance3,22,23, and we therefore included two models comprising the acute (2h) production of mitochondrial oxidants from different sources (mitochondria-targeted paraquat, MPQ, antimycin
A, AA) (Fig. 1a)22,23. All five models conferred impaired uptake of radiolabeled 2-deoxyglucose (2DG) into adipocyte cells following an acute (10 min) insulin treatment, confirming that
cells were insulin resistant (Fig. 1b).
a Adipocyte insulin resistance models and sample sizes. b 3H-2DG uptake into insulin resistant adipocytes at 37 °C after 10 min Data analyzed by two-way ANOVA corrected for multiple
comparisons (Dunnett’s test), control vs insulin-resistant models in unstimulated or stimulated cells (*). Data are presented as mean values +/- S.E.M. n = 3 biologically independent
samples. *p-values (left-to-right): 0.0092, 0.0015, 1.5, 1398 up-regulated and 1410 down-regulated proteins, Supplementary Fig. 1i, Supplementary Data 1). This included 1693 differentially
expressed proteins in CI, 1621 in DEX and 1019 in TNF (Supplementary Fig. 1j, k, Supplementary Data 1). In contrast, only 9 proteins had altered expression levels in response to MPQ and 9 in
response to AA (6 common to both). The absence of widespread proteome changes in these conditions reflects the acute treatment duration (2 h), since in contrast to the phosphoproteome the
proteome requires between 3–6 h to enact dynamic expression changes24. Proteomic changes in CI, DEX and TNF were consistent with those previously reported3. For example, GLUT4 (SLC2A4) and
AKT2 were down-regulated (Supplementary Fig. 1k, Supplementary Data 1), and proteins in pathways such as peroxisome proliferator-activated receptor signaling, insulin signaling, lipid
metabolism (fatty acid metabolism, biosynthesis of unsaturated fatty acids, the mevalonate/terpenoid backbone biosynthesis pathway, cholesterol biosynthesis), branched chain amino acid
metabolism (valine, leucine, and isoleucine degradation) and oxidative phosphorylation were altered (Supplementary Fig. 2a, b). In general, these pathways also behave similarly in the
transcriptome of related models25. To identify functionally associated proteins with altered expression in insulin resistance, we extracted protein-protein interaction (PPI) data from
STRING26 for networks comprising proteins up- or down-regulated in two or more models (388 up-regulated, 621 down-regulated). This revealed PPI clusters enriched in spliceosomal
(up-regulated), endocytic (up-regulated) and ribosomal (up- and down-regulated) proteins, suggesting that these protein networks are sensitive to multiple perturbations that elicit insulin
resistance (Supplementary Fig. 2c, d, Supplementary Data 2). Thus, our deep proteome analysis confirms previous reports of extensive changes in protein expression across multiple models of
insulin resistance and provides a quantitative atlas for studies investigating underlying causes of insulin resistance.
The absence of widespread changes to the proteome in our acute models (MPQ, AA; 2h) emphasizes that insulin resistance in these models is unlikely to be driven at the level of protein
expression. This further prompted us to consider changes to global protein phosphorylation networks, which have been shown to operate on much faster timescales than both transcriptional and
translational machinery24. In our phosphoproteomics data we detected 1,951 insulin-regulated phosphopeptides in control cells that had altered abundance following insulin treatment (log2
fold-change > 0.58 or 0.58 or < −0.58, respectively) (Fig. 3b, c). To enrich these data for sites more likely to be direct substrates of GSK3 in adipocytes (as opposed to downstream of
GSK3), we selected only those that were down-regulated in response to GSK3i and also contained the motif of a GSK3 substrate (pS/T X(2-4) pS/T, where the first S/T is phosphorylated by GSK3
and the second is a priming phosphosite). The resulting 290 phosphopeptides corresponded to 274 phosphosites on 184 proteins (Fig. 3b, c, Supplementary Data 5), and contained previously
identified GSK3 targets such as S641, S645, and S649 on glycogen synthase53, and S514 and S518 on DPYSL254,55, confirming the validity of our approach.
a Pipeline for identification of context-specific kinase substrates, exemplified by GSK3 in 3T3-L1 adipocytes. b Quantification from GSK3 inhibitor phosphoproteomics. c The effect of 20 min
GSK3 inhibition on the 3T3-L1 adipocyte phosphoproteome was tested by two-sided t-tests followed by Benjamini-Hochberg p-value adjustment. Black indicates phosphopeptides significantly
up-regulated or down-regulated by GSK3 inhibition by more than 1.5-fold and blue indicates down-regulated phosphopeptides matching the GSK3 substrate motif. d KSEA in each insulin resistance
model using log2 INS/BAS fold changes and putative GSK3 substrates decreased in CTRL cells (log2 INS/BAS < 0). To examine differences between control cells and models, KSEA27 was performed
using log2 INS/BAS fold changes normalized to control cells (*). *p-values (left-to-right): 0, 0, 0, 0.049, 0. e KSEA27 in unstimulated (‘BASAL’) and insulin-stimulated (‘INS’)
phosphoproteomes using log2 Model/CTRL fold changes and the same substrates as in d. Filled-in columns indicate significant changes in GSK3 activity (p < 0.05). P-values (left-to-right):
0.165, 0.001, 0.006,0.542, 0, 0, 0.069, 0.017, 0.004, 0. f Intensity of GSK3α/β total protein with significant differences compared to control cells indicated (ANOVA, two-sided Dunnett’s
post hoc tests, Benjamini-Hochberg adjustment, *). *p-values (left-to-right, top-to-bottom): 0.0000475, 0.0105, 0.000154, 2.32e−11, 1.98e−5. *0.01 < p < 0.05, **0.001 < p < 0.01, ***p <
0.001. n = 4–6 independent biological replicates. Source data are provided as a Source Data file.
To utilize this atlas of adipocyte-specific GSK3 substrates to analyze our insulin signaling data, we next mapped the 274 putative GSK3 substrate phosphosites onto our 3T3-L1 insulin
resistance phosphoproteome. We found a high overlap between these datasets, identifying 191 corresponding phosphosites that decreased in abundance in response to insulin (log2 insulin/basal
< 0), further supporting that these sites were regulated by GSK3 in adipocytes. Performing a KSEA now using these sites revealed that GSK3 was inactivated in response to insulin in control
cells in our original phosphoproteomics study as expected, and remarkably, that this inactivation was attenuated across all insulin resistance models (Fig. 3d, Supplementary Fig. 5c).
Putative GSK3 substrates with defective dephosphorylation in insulin resistance included S520 and S553 on PHLDB1; S350, S354, and S358 on the microtubule regulator SLAIN2; and S1036 on ASK1
(Supplementary Fig. 5d). Of note, the ASK1 inhibitory site S1040 is the priming site for S1036, and both sites display defective dephosphorylation in four 3T3-L1 models (Fig. 2e). These
sites, therefore, represent an unappreciated intersection between GSK3 and ASK1 signaling that is altered in insulin resistance. In addition, the GLUT4 translocation-regulator PHLDB1
contained a site that was emergent in 4 models (Fig. 2h), marking PHLDB1 as a node of crosstalk for signaling pathways both attenuated and promoted in insulin resistance. Our
context-specific kinase substrate profiling suggests that the deactivation of GSK3 by insulin is impaired in multiple models of insulin resistance, and that this may contribute to the
impaired protein dephosphorylation, and defective insulin-stimulated glucose transport, observed across these models.
Impaired insulin-stimulated GSK3 deactivation could be driven by lower unstimulated activity or elevated insulin-stimulated activity, or both. To distinguish these possibilities, we
performed KSEA on phosphopeptide abundance relative to control cells, under both unstimulated and insulin-stimulated conditions. In unstimulated cells, DEX, TNF and AA had reduced GSK3
activity relative to control, while in insulin-stimulated cells, CI, TNF, MPQ and AA had increased GSK3 activity relative to control (Fig. 3e). Overall, more models had altered GSK3 activity
in the insulin-stimulated state, suggesting that the primary defect of GSK3 regulation in insulin resistance is the inability of insulin to attenuate GSK3 activity.
We next asked whether changes in the abundance of GSK3ɑ and GSK3β isoforms and/or regulatory phosphorylation of GSK3 could explain the observed changes in GSK3 activity. GSK3 protein
expression was decreased in most chronic 3T3-L1 models (Fig. 3f, Supplementary Fig. 5e; GSK3ɑ: CI, DEX, and TNF; GSK3β: DEX, TNF). However, the same changes were not observed in acute models
(MPQ, AA), despite impaired insulin-dependent GSK3 signaling (Fig. 3f). In some cases, impaired attenuation of GSK3 activity by insulin may be partially driven by impaired phosphorylation
of the AKT inhibitory sites, as insulin-mediated phosphorylation of GSK3ɑ S21 was blunted in CI and TNF models, as was insulin-mediated GSK3β S9 phosphorylation in CI, DEX, and TNF (Fig. 2b,
Supplementary Fig. 5e). However, normalizing phosphorylated GSK3 to the total protein abundance suggested that these changes in S21 or S9 phosphorylation in DEX and TNF could potentially be
explained by decreased expression of GSK3, while the changes in CI were additionally mediated by decreased AKT signaling to GSK3 (Supplementary Fig. 5f). Notably, as inhibitory
phosphorylation and protein abundance were decreased to a similar extent in TNF, inhibitory phosphorylation should not explain why insulin-stimulated GSK3 activity was increased in TNF
relative to control. Phosphorylation of GSK3ɑ/β at Y279/Y216 has been reported to enhance kinase activity and may be an autophosphorylation event56. We identified no significant insulin
response in GSK3ɑ Y279, and GSK3β Y216 was not quantified (Supplementary Fig. 5g). However, GSK3ɑ Y279 was weakly decreased by insulin in CTRL cells but not decreased in DEX, TNF, and AA.
Although we cannot exclude the involvement of tyrosine phosphorylation in impaired deactivation of GSK3, the small magnitude of Y279 changes between models suggests that any contribution to
dysregulated GSK3 function may be minor. Although these alterations in protein expression and signaling to GSK3 may, to some extent, explain the behavior of GSK3 in our chronic models (CI,
DEX, and TNF), they do not sufficiently explain the impairment in GSK3 inactivation observed in our acute models (MPQ, AA). This suggests that aside from protein abundance and insulin
signaling to GSK3, other factors that control GSK3 are likely disrupted during insulin resistance.
We next assessed if key findings from 3T3-L1 adipocytes, including impaired GSK3 regulation, were recapitulated in in vivo models of insulin resistance. To this end, we fed mice either a
chow diet (CHOW) or a high-fat high sucrose diet (HFD) for 14 d (insulin resistant (HFD))3. For a third group of mice fed HFD for 14 d, we switched the diet back to chow for a further 5 d
(reversal of insulin resistance (REV), Fig. 4a). In the mice fed a 14 d HFD, insulin-stimulated 2DG into epididymal adipose tissue was reduced compared to the CHOW group, while returning
mice to a chow diet for 5 days improved insulin sensitivity by approximately 40% (Fig. 4b).
a Diet regimes and sample sizes for phosphoproteomic analysis of adipose tissue. b 3H-2DG uptake into epididymal adipose tissue during 10 min intraperitoneal injection with insulin or
saline. Data were analyzed by two-way ANOVA corrected for multiple comparisons (Tukey’s test) to compare insulin-stimulated uptake between ‘CHOW’, ‘HFD’, and ‘REV’ groups (*). Error bars are
S.E.M. n = 12 biologically independent animals. *p-values (left-to-right): < 0.0001, 0.0026, 0.0421. c Quantification from phosphoproteomic analysis of adipose tissue. d The number of
phosphopeptides that were significantly regulated by insulin in CHOW mice, further divided into sites that were defective in HFD mice. The number of phosphopeptides emergent in HFD is also
shown. e The distribution of phosphorylation defects among regulated phosphopeptides on all proteins or proteins considered part of the core insulin signaling pathway. A one-sided Fisher’s
exact test was performed to assess whether regulated phosphopeptides on core insulin signaling protein were less likely to be defective than expected by chance (*p = 4.26e−5). f KSEA was
performed using log2 INS/BAS fold changes and putative GSK3 substrates that were decreased in CHOW mice (log2 INS/BAS < 0). KSEA27 was performed using log2 INS/BAS fold changes in HFD and
REV normalized to CHOW to assess differences between diets (*). *p-values (left-to-right): 0, 0.004. g KSEA27 was performed in the unstimulated (‘BASAL’) and insulin-stimulated (‘INS’)
phosphoproteomes using log2 DIET/CHOW fold changes and the same substrates as in f. Filled-in columns indicate significant changes in GSK3 activity (p < 0.05). P-values (left-to-right):
0.044, 0.008, 0, 0.265. h Intensity of GSK3β S9. Two-sided t-tests were performed to compare HFD or REV to CHOW in unstimulated (#p = 0.0174) or insulin-stimulated mice (not significant).
*/#0.01 < p < 0.05, **/##0.001 < p < 0.01, ***/###p < 0.001. Source data are provided as a Source Data file.
To assess insulin signaling we performed phosphoproteomic analysis of epididymal adipose tissue from CHOW, HFD and REV mice treated with saline or insulin (Fig. 4c, Supplementary Fig. 6a–d).
We identified 319 insulin-regulated phosphopeptides on 210 proteins in CHOW mice (Fig. 4c, Supplementary Data 6). Insulin signaling was substantially rewired in HFD mice, as 203 of these
319 phosphopeptides were no longer insulin-responsive in HFD, while a separate set of 105 phosphopeptides displayed emergent insulin-regulation in HFD (Fig. 4d, Supplementary Fig. 6e,
Supplementary Data 6). Akin to insulin-resistant 3T3-L1 adipocytes, the majority of the 203 defective phosphopeptides were outside core insulin signaling pathways (Fig. 4e), and emergent
phosphorylation was enriched in transcriptional regulators (Supplementary Fig. 6f). We next assessed whether GSK3 activity was altered in insulin-resistant adipose tissue, using our
experimentally-defined list of potential GSK3 substrates. KSEA on the 168 GSK3 substrates downregulated by insulin in CHOW tissue (CHOW log2 INS/BASAL < 0) revealed that insulin-stimulated
GSK3 deactivation was impaired in HFD and partially restored in REV tissue (Fig. 4f). As adipose tissue insulin sensitivity was also impaired in HFD and partially restored in REV (Fig. 4b),
this supports the notion that insulin regulation of GSK3 is important for insulin sensitivity. GSK3 substrates with defective dephosphorylation in HFD tissue included S72 on TRARG1
(Supplementary Fig. 6g). Trarg1 has been implicated in GLUT4 trafficking57,58, and the dephosphorylation of this site may promote GLUT4 translocation59, so Trarg1 may link GSK3 dysregulation
to impaired GLUT4 trafficking in insulin resistance.
As in 3T3-L1 adipocyte models of insulin resistance, the dysregulation of GSK3 in insulin-resistant tissue was due to a combination of altered activity before and after insulin stimulation
(Fig. 4g). In particular, before insulin stimulation, GSK3 activity was decreased in HFD and REV tissue compared to CHOW (Fig. 4g), which may be due to increased inhibitory phosphorylation
of S9 on GSK3β (Fig. 4h). Phosphorylation of S21 on GSK3α was not adequately quantified, and phosphorylation of Y279 on GSK3α was not changed by insulin (Supplementary Fig. 6h). After
insulin stimulation GSK3 activity was elevated in HFD (Fig. 4g), however this cannot be explained by S9 phosphorylation as this was equivalent to that observed in adipose tissue from
CHOW-fed mice (Fig. 4h). In addition, these changes in GSK3 activity were more pronounced in insulin-stimulated tissue compared to unstimulated tissue, supporting the observation we made in
3T3-L1 adipocytes that GSK3 dysregulation is mainly due to the inability of insulin to lower its activity. Collectively, phosphoproteomic analysis of in vivo models of insulin resistance
recapitulated key findings from 3T3-L1 adipocytes, including the observation that regulation of GSK3 by insulin is impaired in insulin resistance.
In our analysis of 3T3-L1 models of adipocyte insulin resistance, we detected multiple insulin signaling alterations shared across different models, leading us to hypothesize that
pharmacological targeting of any one of these alterations may only confer a partial reversal of insulin resistance. As impaired deactivation of GSK3 by insulin was observed in all
insulin-resistant 3T3-L1 models and insulin-resistant adipose tissue, we decided to test this hypothesis on GSK3. We treated insulin-resistant 3T3-L1 adipocytes (CI, DEX, and TNF) with the
GSK3 inhibitors GSK3i, CHIR99021 (CHIR), or AZD2858 (AZD) 1.5 h prior to administration of insulin, and monitored plasma membrane GLUT4 using an antibody that recognizes an exofacial region
of GLUT460, or by stably expressing an HA-GLUT4-mRuby3 reporter construct. GSK3 inhibition was confirmed by reduced phosphorylation of glycogen synthase (Supplementary Fig. 7a). All three
insulin resistance treatments impaired insulin-stimulated GLUT4 translocation in response to 0.5 or 100 nM insulin in wild-type or HA-GLUT4-mRuby3-expressing cells (Fig. 5a, c, Supplementary
Fig. 7b–e). GSK3 inhibition increased cell surface endogenous GLUT4 and HA-GLUT4-mRuby3 in control, TNF and DEX-treated cells. The response to GSK3 inhibition was much greater in TNF and
DEX models than in control cells (Fig. 5b, d) so that in general insulin responses were nearly equivalent to control cells. However, CI-treated cells were largely refractory to GSK3
inhibition (Fig. 5a–d, Supplementary Fig. 7b–e). Notably, the effects of these GSK3 inhibitors in the DEX and TNF models were only observed in insulin-stimulated cells, suggesting that this
intervention acts by specifically augmenting the insulin response.
a Control and insulin-resistant 3T3-L1 adipocytes expressing HA-GLUT4-mRuby3 were pretreated for 90 min with DMSO or a 500 nM LY2090314 (‘GSK3i’) following a 20 min insulin treatment. The
normalized abundance of HA-GLUT4-mRuby3 at the plasma membrane was compared between control and insulin-resistant cells treated with DMSO (*), and between GSK3i-treated cells and
DMSO-treated cells within each insulin resistance model (#), using two-way ANOVAs and Dunnett’s post-hoc tests. *p-values (left-to-right): 0.0164, 0.0191, 0.0080, 0.0359, 0.0190, 0.0011,
0.0003. #p-values (left-to-right): 0.0062, 0.0047, 0.0393, 0.0015, 0.0071. b The percentage increase in PM HA-GLUT4 caused by GSK3 inhibition with 500 nM GSK3i, 10 μM CHIR99021 (‘CHIR’), or
10 μM AZD2858 (‘AZD’) at 0.5 nM or 100 nM insulin. Data were analyzed by mixed-effects analysis corrected for multiple comparisons (two-sided Dunnett’s test), comparing control vs
insulin-resistant models (*). *p-values (left-to-right, top-to-bottom): 0.0576, 0.0127, 0.0186, 0.0038, 0.0284, 0.0147, 0.0572, 0.0063, 0.0566, 0.0022, 0.0377, 0.0403. As in a, b, using
wild-type 3T3-L1 adipocytes and quantification of plasma membrane endogenous GLUT4. P-values in c, left-to-right *