Chemiosmotic nutrient transport in synthetic cells powered by electrogenic antiport coupled to decarboxylation
- Select a language for the TTS:
- UK English Female
- UK English Male
- US English Female
- US English Male
- Australian Female
- Australian Male
- Language selected: (auto detect) - EN
Play all audios:

Cellular homeostasis depends on the supply of metabolic energy in the form of ATP and electrochemical ion gradients. The construction of synthetic cells requires a constant supply of energy
to drive membrane transport and metabolism. Here, we provide synthetic cells with long-lasting metabolic energy in the form of an electrochemical proton gradient. Leveraging the L-malate
decarboxylation pathway we generate a stable proton gradient and electrical potential in lipid vesicles by electrogenic L-malate/L-lactate exchange coupled to L-malate decarboxylation. By
co-reconstitution with the transporters GltP and LacY, the synthetic cells maintain accumulation of L-glutamate and lactose over periods of hours, mimicking nutrient feeding in living cells.
We couple the accumulation of lactose to a metabolic network for the generation of intermediates of the glycolytic and pentose phosphate pathways. This study underscores the potential of
harnessing a proton motive force via a simple metabolic network, paving the way for the development of more complex synthetic systems.
Living cells require energy to fuel essential biosynthetic processes, to grow and divide, and to maintain homeostasis and an out-of-equilibrium metabolic state. The two main metabolic energy
currencies of a cell are ATP and H+ (or Na+) electrochemical gradients; the latter are referred to as proton and sodium motive force (SMF), respectively. A proton motive force (PMF) can be
generated by respiration, light-driven electron transfer reactions, or ATP hydrolysis1,2. The PMF is composed of a H+ chemical gradient, ΔpH (typically alkaline inside), and an electrical
potential, ΔΨ (typically negative inside):
where R, T, and F correspond to the gas constant, temperature, and Faraday constant, respectively, and ΔpH = pHi–pHo.
Fermentative bacteria are unable to form a PMF by respiration or photosynthetic reactions, and the PMF can be formed via ATP hydrolysis by F1F0-ATPase3,4. However, it is also possible to
generate a PMF without involvement of high-energy intermediates like ATP, using electrogenic uniport or electrogenic precursor-product exchange in combination with metabolic breakdown of the
substrate inside the cell3,5. An example is the internal decarboxylation of substrate (precursor), catalyzed by a soluble decarboxylase, coupled to the uptake of precursor and extrusion of
product, mediated by a specific transport protein6.
Bacteria of the genera Lactobacillus, Lactococcus, Leuconostoc, and Pedicoccus possess an L-malate decarboxylation pathway, also known as malolactic fermentation, which generates a PMF and
counterbalances intracellular acidification7,8. In Lactococcus lactis, the cytosolic L-malate decarboxylase (malolactic enzyme, MleS) catalyzes the decarboxylation of L-malate to L-lactate
plus CO2, while a membrane-embedded secondary transporter, MleP, exchanges di-anionic L-malate for L-lactate or mono-anionic L-malate for L-lactic acid. The decarboxylation reaction results
in an inward gradient for L-malate and an outward gradient for L-lactate, establishing the driving forces for the L-malate/L-lactate exchange5. The CO2 may leave the cell by passive
diffusion without affecting pH7. Consumption of scalar protons during the decarboxylation reaction leads to an intracellular alkalinization and, therefore, generates a ΔpH across the plasma
membrane. The gradual decrease in external L-malate and increase in L-lactate can rise the external pH, because the molecules have a different acidity (L-malate: pKa1 = 3.4, pKa2 = 5.1; and
L-lactate: pKa = 3.8)7,9, but generally the impact of L-malate decarboxylation will be highest for the internal pH.
The exchange of di-anionic L-malate for L-lactate or mono-anionic L-malate for L-lactic acid is electrogenic and thus generates a membrane potential (ΔΨ, inside negative). Both components of
the PMF are generated in different but coupled steps, which is mechanistically very different from how the PMF is generated in respiration or photosynthesis or upon ATP hydrolysis by
F1F0-ATPase. We refer to the combined action of MleP and MleS as the L-malate decarboxylation pathway. The compartmentalization of the L-malate decarboxylation pathway makes it possible to
conserve the low amount of free energy from the decarboxylation reaction (−17 to −25 kJ mol−1)6, chemiosmotically into a PMF10. The free energy change of a carboxylation reaction is too
small for the synthesis of ATP from ADP plus Pi, but the formed PMF can be used to supply the cell with ATP and fuel other essential functions like the transport of nutrients. The PMF can
also facilitate processes like cell division11, (membrane) protein insertion/secretion12 and intercellular communication13,14. Various other PMF-generating precursor-product
exchange–decarboxylation pathways have been described (oxalate2−/formate−, citrate2−/L-lactate−, arginine+/agmatine2+, ornithine+/putrescine2+, glutamate−/γ-aminobutyrate,
histidine/histamine+, tyrosine/tyramine+, aspartate−/alanine)15,16,17,18,19,20,21,22.
In this work, we explore the potential of the L-malate decarboxylation pathway for the generation of a PMF in submicrometer-size lipid vesicles. We co-reconstituted the pathway with
Escherichia coli glutamate transporter GltP23,24 and lactose transporter LacY25, and we show long-lasting transport and high steady-state levels of these solutes. We also demonstrate the
utilization of L-malate-dependent lactose accumulation in downstream metabolic reactions. The sustainable energy conversion by the L-malate decarboxylation pathway enables more complex
cell-like metabolic functions and sets the foundations for further out-of-equilibrium networks in synthetic cells.
The L-malate decarboxylation pathway generates a proton motive force by the action of two proteins: the integral membrane L-malate/L-lactate exchanger (MleP) and the soluble, luminal,
L-malate decarboxylase (MleS). To guide the reconstitution of this system in lipid vesicles we characterized both proteins. A summary of the data obtained and in literature is presented in
Table 1.
MleP belongs to the 2-hydroxycarboxylate transporter family (2HCT), which function as symporters or exchangers26. MleP has been described as a L-malate/L-lactate exchanger7 with a molecular
weight of 47.9 kDa and 9–14 predicted TMS26,27. We overexpressed the 10× His-tagged MleP in L. lactis, purified the protein via immobilized metal-affinity chromatography (IMAC) and
incorporated the protein in lipid vesicles composed of dioleoyl-phospholipids DOPE:DOPG:DOPC 1:1:2 (mol ratio) or E. coli polar lipids: egg PC 3:1 (mol ratio). Figure 1a shows that MleP is
reconstituted with an efficiency of 51 ± 9% (Supplementary Fig. 1); the double band is assigned to different structural conformations and incomplete denaturation by SDS. We also observe some
dimeric MleP, similar to what has been reported for other members of the 2HCT family26.
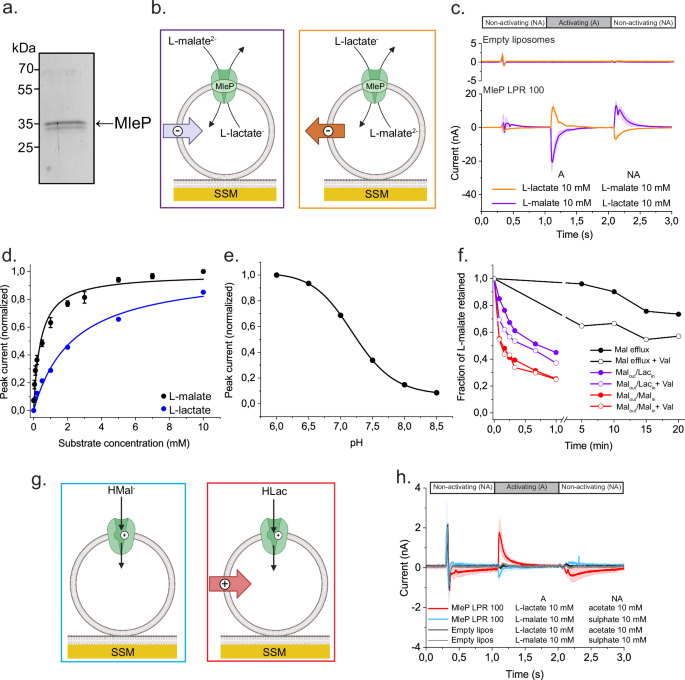
a SDS-polyacrylamide gel of MleP in E. coli polar lipids:egg PC 3:1 (mol ratio). (Uncropped gel in Supplementary Fig. 1a). b Cartoon of MleP-liposomes loaded onto SSM, indicating the
direction of charge transfer during the L-malateinflux/L-lactateefflux (violet box) and L-lactateinflux/L-malateefflux exchange (orange box). c Current traces recorded by SSM-based
electrophysiology of MleP LPR 100 proteoliposomes (n = 3) or empty liposomes (n = 2) for L-malateinflux/L-lactateefflux (violet, L-malate jump) and exchange in the opposite direction
(orange, L-lactate jump). d Normalized peak currents obtained from ON signals for different concentrations of L-malate (black, n = 3) and L-lactate (blue, n = 2) jumps on L-lactate- and
L-malate-loaded MleP liposomes, respectively. Data of peak currents represent the mean from independent experiments with n different preparations of proteoliposomes. Error bars represent ±
SD. Solid lines correspond to a Michaelis–Menten fit (black R2 = 0.971, blue R2 = 0.985). e pH dependence of peak currents obtained from L-malate jumps at the indicated external pHs on MleP
LPR 250 liposomes loaded with L-lactate at pH 7. Data are normalized to the value at pH 6 and correspond to the average from n independent experiments with different preparations of
proteoliposomes (n = 2). Solid line represents a sigmoidal function fit of the data (R2 = 0.999). f 14C-L-malate efflux measurements performed on MleP-liposomes (LPR 200 in DOPE:DOPG:DOPC
1:1:2 (mol ratio)) diluted in buffer containing L-lactate (violet, exchange Malout/Lacin), L-malate (red, homologous exchange Malout/Malin) or without counter substrate (black, Mal efflux).
Val indicates valinomycin addition and the generation of a −100 mV K+ diffusion potential. g Cartoon of half turnover transport in MleP-liposomes. h Current traces recorded upon a L-malate
(blue, n = 3) or L-lactate (red, n = 3) jump on MleP LPR 100 or empty liposomes loaded with sulfate or acetate, respectively. Current traces in c, h. are presented as the average from
independent experiments with different preteoliposome preparations and different SSM sensor chips. Shaded areas = ± SD. Mal = L-malate, Lac = L-lactate. b, g were created with Biorender.com
released under a Creative Commons Attribution-NonCommercial-NoDerivs 4.0 International license.
We determined the electrogenic nature of L-malate/L-lactate exchange by solid-supported membrane (SSM)-based electrophysiological measurements (Fig. 1). The net transfer of charge by the
exchange of divalent L-malate for monovalent L-lactate is detected as a transient current via the capacitive coupling between the supported membrane and the vesicles28. A negative current is
observed when external L-lactate (non-activating solution) is replaced with L-malate (activating solution) with L-lactate-loaded MleP-vesicles adsorbed to the supporting membrane (Fig. 1b,
c). A positive peak current is obtained when a L-lactate jump is triggered on L-malate-loaded MleP vesicles, because the charge transport is now in the opposite direction (Fig. 1b, c). There
is no substantial current when the same solution exchange is performed in liposomes without MleP (empty liposomes) (Fig. 1c). We reduced the possibility of obtaining electrical artifacts
from differences in ionic strength between the activating and non-activating solutions by replacing lactate and malate with acetate and sulfate, respectively, which carry the same charge but
are not recognized as substrates by MleP. These results confirm the electrogenic character of the L-malate/L-lactate exchange.
We found that MleP reconstituted at a lipid-to-protein (LPR) ratio of 100 was able to exchange L-malate for L-lactate in the chemically defined synthetic lipid mixture DOPE:DOPG:DOPC 1:1:2
(mol ratio), but the activity was 7 times higher in liposomes composed of E. coli polar lipids: egg PC 3:1 (Supplementary Table 1, Supplementary Fig. 2). Therefore, we used the E. coli polar
lipid/egg PC mixture for the majority of the reconstitutions at LPR 100 and further SSM measurements. The amplitude of the peak current (Ip) is proportional to the steady state
L-malate/L-lactate exchange activity29. The peak current amplitude increases in a hyperbolic manner with the increment in the outside concentration of L-malate or L-lactate, while keeping
the internal concentration of L-lactate or L-malate at 30 mM (Fig. 1d and Supplementary Fig. 3a–c). We find that the Kmapp for L-lactate is 7-fold higher than for L-malate (Table 1 and Fig.
1d).
Since the L-malate decarboxylation leads to an internal as well as external pH change, (see Introduction and7), we performed L-malate jumps on L-lactate-loaded vesicles at pH values between
6 and 8.5 (Supplementary Fig. 3d). Here, we used MleP LPR 250 vesicles to have a similar number of transporters per vesicle as in the experiments with the L-malate decarboxylation pathway.
The L-malate/L-lactate activity is highest at pH 6 and decreased at more alkaline pHs (Fig. 1e). The pH dependence most likely reflects the activity of MleP and not the availability of
substrate, because the change in concentration of di-anionic L-malate is only 4% between pH 6 and pH 8.5. Besides L-malate/L-lactate exchange, MleP facilitates uniport of L-malate27, which
would also be electrogenic and enable L-malate decarboxylation because L-lactate can leave the vesicles in the protonated form (L-lactic acid) by passive diffusion. Indeed, transport assays
with vesicles loaded with radiolabelled L-malate (Fig. 1f) show efflux of L-malate but with a rate at least one-order of magnitude slower than L-malate/L-lactate exchange. The electrogenic
nature of both the uniport and exchange is shown by the increase of activity in the presence of the K+ ionophore valinomycin, which dissipates the membrane potential. Thus, two different
methodologies (SSM-based electrophysiology and efflux of radiolabelled substrate) confirm that MleP is an electrogenic secondary antiporter/uniporter.
The slow kinetics of the uniport reaction complicates the SSM measurements, but we recorded small peak currents when L-malate or L-lactate jumps were applied on MleP vesicles without
counter-substrate (Fig. 1g, h). These peak currents can be interpreted as pre-steady state currents that originate from a half turnover, i.e. L-malate or L-lactate influx, which is followed
by a slow return of the empty carrier. Interestingly, the peak current from the L-lactate jump is not only 5-fold larger in magnitude but also has a positive direction, indicative of
movement of positive charge in or negative charge out of the vesicles.
L-malate decarboxylase MleS catalyzes the decarboxylation of L-malate to L-lactate, releasing carbon dioxide and consuming a proton (Fig. 2a). Protons are used to compensate for the free
electron pair remaining in the organic intermediate after the heterolytic cleavage that releases CO2 (Supplementary Fig. 4)6. MleS is a homodimeric protein with a molecular weight of 60–65
kDa per subunit and has NAD+ and Mn2+ as bound cofactors30,31,32. The decarboxylation reaction proceeds in three consecutive steps without detectable accumulation of intermediates: (i)
L-malate oxidation to oxaloacetate; (ii) decarboxylation of oxaloacetate to pyruvate; and (iii) pyruvate reduction to L-lactate (Supplementary Fig. 4)26. The NAD+ consumed in the first step
is recycled in the third step. The proton consumption leads to alkalinization of the cytoplasm.
a L-malate decarboxylation reaction catalyzed by MleS. b Representative size-exclusion chromatogram of MleS and SDS-polyacylamide gel showing purified MleS. Similar results were obtained
from three independent purification trials. (Uncropped gel in Supplementary Fig. 27). c pH traces were recorded with a pH microelectrode for the L-malate decarboxylation reaction at 30 °C
and pH 7. The reaction started with the addition of 5 mM Na-L-malate at t = 0. pH traces in the absence of Mn2+ and NAD+ and in the presence of 5 mM and 25 mM of Na-L-lactate are indicated.
pH was recorded at intervals of 1 s. d pH curves obtained for the decarboxylation reaction at different concentrations of Na-L-malate using 150 nM MleS and pH 7. pH curves correspond to the
mean from independent experiments with different enzyme preparations (n = 3). Shaded regions correspond to ± SD. e L-malate dependence of MleS calculated from the initial rates of
alkalinization (first 10 seconds) obtained from pH curves in d, and using a titration curve (Supplementary Fig. 5) to convert pH changes into µmol of H+. Solid line corresponds to a
Michaelis-Menten fit of the experimental data (R2 = 0.987). f pH dependence of the initial rates of H+ consumption obtained for the decarboxylation of 5 mM Na-L-malate in low buffered
solution at 30 °C and using 150 nM of enzyme. For pHs 4–5 the buffer solution was 2 mM of K-acetate, while for pHs 6–8 the buffer consisted of 2 mM K-phosphate. Initial rates of H+
consumption were calculated as indicated in e, using distinct titration curves for every pH. The solid line corresponds to the fitting of experimental data to a logistic peak function (R2 =
0.992). Data points in e represent the mean of the H+ consumption rate ± SD (n = 3) from independent experiments with different enzyme preparations. Data points in f represent the mean of
the H+ consumption rate ± SD (n = 3) from independent experiments with the same enzyme preparation. a was created with Biorender.com released under a Creative Commons
Attribution-NonCommercial-NoDerivs 4.0 International license.
We overexpressed L. lactis MleS and purified the protein by IMAC and size-exclusion chromatography (SEC). A single and symmetrical peak in the SEC and SDS-polyacrylamide gel confirms the
production of a monodisperse protein (Fig. 2b). The L-malate decarboxylation activity of MleS was determined by pH measurements in 2 mM of potassium phosphate and is presented as H+
consumption rate (µmol H+ consumed min−1 mg MleS−1) (Fig. 2c–f). The H+ consumption was calibrated by titration of the reaction buffer with NaOH (Supplementary Fig. 5). We noticed that on
longer timescales the amount of consumed H+ was lower than expected for a reaction with a Keq of 5.5 × 10², calculated by eQuilibrator33 (Supplementary Fig. 6d). To verify if the enzymatic
reaction was not running to completeness, we followed the production of L-lactate by HPLC after derivatization with 9-chloromethyl anthracene (Supplementary Fig. 6). Virtually complete
decarboxylation of 5 mM L-malate was confirmed by the production of approximately 5 mM of L-lactate (Supplementary Fig. 6 d). We explain the leveling off of the pH by the dissolution of CO2
and the formation of bicarbonate plus a proton, which opposes the alkalinization of the decarboxylation reaction. The pH recordings and L-lactate measurements show excellent correspondence
for the initial 30 s of the reaction (Supplementary Fig. 6d, inset), and therefore, the initial rates of H+ consumption were used to determine the kinetic parameters of MleS (Table 1 and
Fig. 2c–f). There is no deleterious effect of L-lactate up to 5 mM (Fig. 2c and Supplementary Fig. 7), but the initial rate of H+ consumption was reduced by 50% in 25 mM L-lactate (Fig. 2c).
The Kmapp for L-malate is 1.4 ± 0.4 mM and Kmapp for NAD+ is 42 µM (Supplementary Fig. 8) at pH 7. In summary, we show that MleS is a relatively fast enzyme with a kcat of 266 ± 14 s−1
around pH 7.
We determined the coupled activities of MleP and MleS in vesicles in which we first reconstituted MleP and then encapsulated MleS, along with NAD+ plus MnCl2 (Fig. 3a). We used MleS
concentrations and MleP LPRs that would yield at least one dimer, even in the smallest vesicles (~100 nm); the other components were encapsulated in a large excess (Table 2). We encapsulated
the hydrophilic fluorescent probe pyranine (8-hydroxypyrene-1,3,6-trisulfonic acid or HPTS) for ratiometric quantification of the intravesicular pH (Supplementary Fig. 10). Preliminary
experiments with liposomes showed that a small fraction of pyranine is retained at the outer surface of the vesicles, even after extensive washing (two cycles of ultracentrifugation and
resuspension, and a final gel filtration step) (Supplementary Fig. 11). Therefore, we included the collisional quencher DPX (p-xylene-bis-pyridinium bromide) in the external medium for every
measurement34. Additionally, we inhibited any MleS, possibly adsorbed to the outer surface of the vesicles, by using EDTA to chelate Mn2+ ions that are required for activity (Supplementary
Fig. 12a). Due to the low rate of L-malate uniport by MleP (Fig. 1f), we included 2 mM of L-lactate inside the vesicles to enable rapid L-malate/L-lactate exchange. We kept the same
concentration in the external medium, because L-lactic acid (in fast equilibrium with L-lactate) rapidly permeates the membrane (Supplementary Fig. 18a). Indeed, when L-lactate is not
initially present in the external medium, the alkalinization is slower because initially, only L-malate uniport is possible, but the internal pH reaches a higher point than in the presence
of external L-lactate (Supplementary Fig. 13).
a Cartoon of the L-malate decarboxylation pathway in liposomes. The consumption of H+ leads to an internal alkalinization and thus a ΔpH (alkaline inside) across the membrane (violet). The
electrogenic exchange of internal L-lactate by external L-malate mediated by MleP generates a ΔΨ (negative inside) (green). b SDS-polyacrylamide gel of MleP LPR 250 (w/w) proteoliposomes in
E. coli polar lipids:egg PC 3:1 (mol ratio) with 2.5 µM MleS encapsulated. (Uncropped gel in Supplementary Fig. 9). c Internal pH of full system (MleP+MleS) reported by pyranine (n = 5) or
only MleS (No MleP, n = 2) or only MleP (No MleS, n = 2). Na-L-malate was added at t = 0 to start the decarboxylation pathway (downward arrow). d Effect of pH on the ΔpH formed by the
L-malate decarboxylation pathway reconstituted in liposomes. e Effect of dissipation of ΔΨ (red, n = 3) and ΔpH (dark yellow) on the internal pH (as indicated in c) with valinomycin or
nigericin, respectively. Valinomycin was present before addition of L-malate and nigericin addition is indicated by an upward arrow. f Total L-lactate produced from the L-malate
decarboxylation pathway (as in c), quantified by RP-HPLC after 9-CMA derivatization. Data points correspond to the mean of L-lactate concentration from independent replicates with different
sample preparations (n = 2). Internal pH curves in c–e correspond to the mean of pH from n independent experiments with different preparations of proteoliposomes. pH curves were calculated
from the ratio of the pyranine fluorescence intensities at the excitation wavelengths 450 nm and 405 nm, using the calibration curve in Supplementary Fig. 10. Shaded areas represent ± SD. a
was created with Biorender.com released under a Creative Commons Attribution-NonCommercial-NoDerivs 4.0 International license.
Upon addition of 10 mM L-malate to the MleP-MleS containing vesicles, the internal pH increased from 7.0 to 7.50 ± 0.03 (Fig. 3c) and then over a period of 10 h gradually decreased to 7.34 ±
0.07 (Supplementary Fig. 14). The drop in internal pH was not observed at pH 6.0 (Fig. 3d). No alkalinization was observed when either MleP or MleS were absent (Fig. 3c), indicating that
the formation of a pH gradient (ΔpH) requires the coupled activities of MleP and MleS. The rate of alkalinization increases with lower LPR (more MleP per vesicle) and higher amounts of
encapsulated MleS (Supplementary Fig. 15). Although the kcat of the enzymatic reaction is ≈10× higher than the estimated turnover number of MleP, the MleP/MleS ratio (in molecules per
vesicle) was always higher than 1 (range 2–13), explaining the increase in activity with MleS concentration (Supplementary Fig. 15). However, the rate of acidification shows a stronger
dependence on the MleP than MleS concentration. A slight decrease in internal pH was observed upon addition of L-malate to vesicles lacking MleS (Fig. 3c), which may reflect uniport of
L-malateH− and dissociation of the proton in the vesicle lumen.
To demonstrate that the internal alkalinization results in a H+ gradient across the membrane we used the ionophore nigericin, which exchanges K+ for H+. Indeed, nigericin collapses the H+
gradient (Fig. 3e). The formation of a membrane potential by L-malate decarboxylation is evident from the accelerated alkalinization in the presence of the K+-selective ionophore
valinomycin, which dissipates the membrane potential ΔΨ (Fig. 3e). The ΔΨ (inside negative) slows down the L-malate/L-lactate exchange decreasing thereby the activity of the L-malate
decarboxylation pathway.
Interestingly, when the L-malate decarboxylation pathway runs at pH 6, which is the optimal pH for MleS and MleP (Figs. 1e and 2f), the H+ gradient is maintained constant for longer periods
of time (Fig. 3d). Finally, CO2 can leave the vesicles by passive diffusion but it can also be converted into bicarbonate plus a proton and thus contribute to acidification of the vesicle
lumen.
Next, we monitored the formation of the ΔΨ, using the fluorescent probe DiSC3(5) (3,3’-dipropylthiadicarbocyanine iodide)35,36. This carbocyanine distributes uniformly over the inner and
outer leaflet when ΔΨ = 0 (Fig. 4a). ΔΨ