NPC1 controls TGFBR1 stability in a cholesterol transport-independent manner and promotes hepatocellular carcinoma progression
- Select a language for the TTS:
- UK English Female
- UK English Male
- US English Female
- US English Male
- Australian Female
- Australian Male
- Language selected: (auto detect) - EN
Play all audios:

Niemann-Pick disease type C protein 1 (NPC1), classically associated with cholesterol transport and viral entry, has an emerging role in cancer biology. Here, we demonstrate that knockout of
Npc1 in hepatocytes attenuates hepatocellular carcinoma (HCC) progression in both DEN (diethylnitrosamine)-CCl4 induced and MYC-driven HCC mouse models. Mechanistically, NPC1 significantly
promotes HCC progression by modulating the TGF-β pathway, independent of its traditional role in cholesterol transport. We identify that the 692-854 amino acid region of NPC1’s transmembrane
domain is critical for its interaction with TGF-β receptor type-1 (TGFBR1). This interaction prevents the binding of SMAD7 and SMAD ubiquitylation regulatory factors (SMURFs) to TGFBR1,
reducing TGFBR1 ubiquitylation and degradation, thus enhancing its stability. Notably, the NPC1 (P691S) mutant, which is defective in cholesterol transport, still binds TGFBR1, underscoring
a cholesterol-independent mechanism. These findings highlight a cholesterol transport-independent mechanism by which NPC1 contributes to the stability of TGFBR1 in HCC and suggest potential
therapeutic strategies targeting NPC1 for HCC treatment.
Liver cancer presents a significant global health challenge, with an increasing incidence worldwide1,2,3. It ranks as the sixth most common malignancy globally, with its mortality rate being
the third highest among cancers4,5. Hepatocellular carcinoma (HCC) is the most prevalent form of primary liver cancer, accounting for approximately 90% of all liver cancer cases1. The
treatment of HCC faces hurdles such as a high recurrence rate and a limited survival period, with existing clinical therapies yielding suboptimal results. Therefore, there is a pressing need
for in-depth research into the molecular mechanisms driving HCC progression, which could lead to the discovery of innovative and effective diagnostic biomarkers and drug targets, offering
avenues for treatment.
Previous research has indicated that cholesterol homeostasis is significantly disrupted in HCC6. NPC1, a protein commonly associated with cholesterol transport, has been identified as having
a high prognostic risk score in HCC6,7. NPC1 is a large protein, that spans the membrane 13 times and is predominantly localized in the late endosome/lysosome (LE/Ly) membrane. Diseases
related to NPC1 include Niemann-Pick disease type C1, a rare autosomal recessive genetic disorder. Dysfunctional NPC1, resulting from mutations in the NPC1 gene, leads to excessive
accumulation of intracellular lysosomal cholesterol. This pathogenesis is characterized by features such as hepatosplenomegaly, cognitive impairment, and progressive and disabling
neurological symptoms8,9,10,11,12,13,14. Furthermore, mutations in NPC1 have been identified as a risk factor for childhood and adult morbid obesity15,16,17. NPC1’s role extends beyond
genetic disorders, as it has been implicated in various viral infections. For instance, the Ebola virus spike glycoprotein (GP) binds specifically to NPC1 in the LE/Ly, triggering cellular
infection18,19,20,21. Additionally, NPC1 has been associated with other viral infections, including HIV-122, Chikungunya virus23 and certain hepatoviruses24. Despite these associations, the
exact role of NPC1 in the context of HCC remains unclear, warranting further investigation.
In this work, we elucidate the critical roles of NPC1 in the development and progression of HCC using knockout (KO) mouse models. Interestingly, we find that NPC1 promotes the TGF-β pathway
by stabilizing the protein TGFBR1, independent of its role in cholesterol transport. This function positions NPC1 as a facilitator of tumor progression and metastasis in HCC. Furthermore, we
reveal that NPC1 interacts with TGFBR1 and impedes the binding between TGFBR1 and the SMAD7/SMURFs complex, thereby reducing the ubiquitylation of TGFBR1. These insights not only shed light
on the molecular mechanisms underpinning HCC progression but also establish NPC1 as both a potential prognostic marker and therapeutic target for combating HCC.
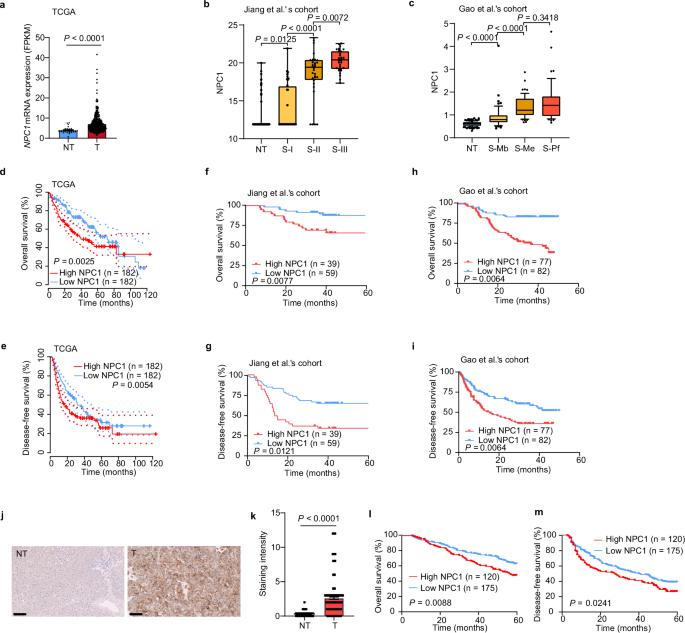
We analyzed The Cancer Genome Atlas (TCGA) datasets and found that NPC1 was significantly upregulated in tumors compared with adjacent tissues in 52% (12 out of 23) of TCGA cancer types,
including HCC (Fig. 1a and Supplementary Fig. 1a). We also found that both protein and mRNA levels of NPC1 were significantly elevated in HCC tissues compared with paired non-tumor tissues.
Furthermore, NPC1 expression showed a significant increasing trend in correlation with the prognostically associated proteomic subtypes in HCC patients from the cohorts of Jiang et al.’s6
and Gao et al.’s25 (Fig. 1b, c and Supplementary Fig. 1b, c). Patients with high NPC1 expression had significantly worse overall survival (OS) and disease-free survival (DFS) than those with
low NPC1 expression (Fig. 1d–i).
a–c Upregulation of NPC1 mRNA (a) or protein (b, c) in paired non-tumor tissues (NT) and tumor tissues (T) in TCGA datasets (a) (NT, n = 32; T, n = 375), Jiang et al.’s cohort (b) (NT, n =
98; S-I, n = 36; S-II, n = 32; S-III n = 33) and Gao et al.’s cohort (c) (NT, n = 159; S-Mb, n = 55; S-Me, n = 57; S-Pf, n = 47). d–i Kaplan–Meier overall survival (d, f, h) and disease-free
survival (e, g, i) curves of individuals with high or low NPC1 expression in TCGA datasets (d, e), Jiang et al.’s cohort (f, g) and Gao et al.’s cohort (h, i). j Representative IHC staining
of TMA with NPC1 antibodies in an independent cohort of HCC (n = 295 biologically independent samples); scale bars, 100 μm. k Staining intensity of NPC1 between NT and T samples from TMA (n
= 295 biologically independent samples). l, m Kaplan–Meier overall survival (l) and disease-free survival (m) curves of individuals with high or low NPC1 expression. In the box plots, the
middle bar represents the median, and the box represents the interquartile range; bars extend to 1.5× the interquartile range. Data are presented as the mean ± s.e.m. (a, k). Statistical
significance was determined by Mann–Whitney U test (a–c, k) or log-rank test (d–i, l, m). Source data are provided as a Source Data file.
To further investigate the prognostic value of NPC1 in HCCs, we performed a tissue microarray (TMA)-based immunohistochemistry (IHC) study of NPC1 in HCC tumor and paired non-tumor liver
tissues. High NPC1 expression was found to be significantly associated with poor prognosis in HCC patients (both OS and DFS), further suggesting that NPC1 plays a critical role in HCC (Fig.
1j-m and Supplementary Data 1).
Evaluation of NPC1 function in HCC was performed both in vivo and in vitro. To investigate NPC1’s role in HCC progression, we engineered PLC/PRF/5 cells with stable overexpression of NPC1,
and HepG2 and MHCC-97H cells with stable knockdown of NPC1 (Fig. 2a and Supplementary Fig. 2a). Overexpression of NPC1 significantly increased the proliferation of PLC/PRF/5 cells
(Supplementary Fig. 2b), while knockdown of NPC1 notably suppressed the proliferation of HepG2 and MHCC-97H cells (Supplementary Fig. 2c, d). Additionally, enhanced NPC1 expression
substantially increased the migration and invasion abilities of PLC/PRF/5 cells (Fig. 2b, d), while silencing NPC1 significantly reduced these abilities (Fig. 2c, e and Supplementary Fig.
2e, f). To exclude potential off-target effects, we reintroduced NPC1 into NPC1-knockdown HepG2 and MHCC-97H cells (Fig. 2a and Supplementary Fig. 2a). Reintroduction of NPC1 almost
completely restored the proliferation, migration, and invasion capacities in both cell lines (Fig. 2c, e and Supplementary Fig. 2c–f). Notably, the slight reduction in proliferation rate
(10%–15%, as shown in Supplementary Fig. 2g–i) could not account for the nearly 70% decrease in migration ability observed in serum-free medium.
a Confirmation of NPC1 overexpression, NPC1 knockdown and re-expression in HCC cells. b-e Transwell assay to examine the effect of NPC1 on HCC cell migration (b, c) or invasion (d, e); scale
bars, 100 μm. f–i 1×10⁶ Luciferase-expressing HCC cells (MHCC-97H) were injected into NOD SCID mice by tail vein. The mice were euthanized 8 weeks later by a cervical dislocation.
Representative images of whole body luminescence monitoring of NOD SCID mice injected via tail vein with HCC cells 8 weeks after injection (f). Lung and liver tissues were isolated for
analysis of IVIS imaging (g). Representative H&E staining images of lung tissues are shown; scale bars, 500 μm; insets: fivefold magnification; scale bars, 100 μm (h). The incidence of lung
metastasis in mice (i). (n = 8 mice per group). Data are presented as the mean ± s.e.m. n = 3 (b–e) biologically independent samples (b–e). Statistical significance was determined by
two-tailed unpaired Student’s t-test (b–e). a–e Data were verified in three independent experiments. Source data are provided as a Source Data file.
To further explore NPC1’s role in both tumor growth and metastasis, we utilized a subcutaneous tumor inoculation model alongside a mouse tail vein metastasis model. In the subcutaneous
model, NPC1 knockdown led to a significant reduction in tumor size and weight, while reintroducing NPC1 effectively restored tumor growth (Supplementary Fig. 2j-m). In the tail vein
metastasis model, NPC1 depletion resulted in a significant reduction in lung tumor metastases, further supporting NPC1’s critical role in tumor metastasis (Fig. 2f–i). Collectively, these
findings highlight NPC1 as a key promoter of HCC progression.
To investigate the mechanism through which NPC1 promotes HCC progression, we performed proteomic analysis on PLC/PRF/5 and HepG2 cells following NPC1 knockdown. Differentially expressed
proteins were identified, and pathway enrichment analysis revealed that NPC1 knockdown significantly inhibited the TGF-β pathway in HCC cells (Supplementary Fig. 3a, b). Notably, activation
of the TGF-β pathway is a hallmark of S-III HCC, which is typically associated with a poor prognosis after first-line surgery6. Additionally, the TGF-β pathway is closely linked to
epithelial-mesenchymal transition and cancer cell invasion and metastasis26,27.
We further validated the influence of NPC1 on TGF-β signaling in HCC cells. In cells overexpressing NPC1, there was a significant increase in the protein levels of TGFBR1, p-SMAD2 and
p-SMAD3 (Fig. 3a). Conversely, NPC1 knockdown led to a notable decrease in these protein levels (Fig. 3b and Supplementary Fig. 3c). Accordingly, NPC1 overexpression increased the mRNA
levels of MMP2, MMP9 and COL5A3 in PLC/PRF/5 cells (Fig. 3c). In contrast, knockdown of NPC1 in HepG2 cells resulted in a downregulation of these genes (Fig. 3d). Furthermore, high
expression of these target genes was significantly associated with reduced OS in HCC patients, as evidenced by data from Jiang et al.’s cohort (Supplementary Fig. 3d–f). Functionally, NPC1
knockdown reduced cell migration in HepG2 and MHCC-97H cells, independent of TGF-β1 treatment (Fig. 3e and Supplementary Fig. 3h). In cells overexpressing NPC1, migration was significantly
increased regardless of TGF-β1 stimulation, although TGF-β1 treatment in the control group induced higher migration compared to NPC1-overexpressing cells without TGF-β1 (Supplementary Fig.
3g). These findings suggest that SMAD2/3 activation is a critical pathway regulated by NPC1 in promoting HCC metastasis.
a, b Immunoblot analysis of TGFBR1, p-SMAD2, p-SMAD3, SMAD2, SMAD3 and NPC1 expression in PLC/PRF/5 cells with NPC1 stable overexpression (a) or HepG2 cells with NPC1 stable knockdown (b).
c, d qPCR (n = 3 biological replicates) was used to examine the mRNA level of TGF-β target genes in NPC1-overexpression PLC/PRF/5 cells (c) or in NPC1-knockdown HepG2 cells with/without
further overexpression of NPC1 (d). e Transwell assay was performed in NPC1-knockdown HepG2 cells with or without TGF-β1 (10 ng/mL) treatment; scale bars, 100 μm. f Immunoblot analysis of
TGFBR1, p-SMAD2, SMAD2, and NPC1 expression in NPC1-knockdown HepG2 cells with further overexpression of NPC1 or NPC1 (P691S). g Cells related to (f) were fixed and stained with filipin to
label free cholesterol accumulated in LE/Ly; scale bars, 10 μm. h Transwell assay was performed in cells related to (f); scale bars, 100 μm. Data are presented as the mean ± s.e.m. n = 3 (c,
d, e, h) biologically independent samples. Statistical significance was determined by two-tailed unpaired Student’s t-test (c, d, e, h). All experimental data were verified in three
independent experiments. Source data are provided as a Source Data file.
Next, we explored whether NPC1’s regulation of the TGF-β pathway depends on its cholesterol transport function. To assess the cholesterol transport activity, we employed Filipin III
staining, a fluorescent probe that binds specifically to unesterified cholesterol in fixed cells28. As shown in Fig. 3g, NPC1 knockdown resulted in significant intracellular cholesterol
accumulation. Re-expression of wild-type NPC1, which possesses intact cholesterol transport function, rescued this phenotype, reducing cholesterol accumulation to normal levels. However, the
P691S mutant NPC1, which is known to lack cholesterol transport activity29,30, did not reverse the cholesterol accumulation. Following reintroduction of NPC1 (wild-type or P691S mutant), we
observed restored levels of TGFBR1 and p-SMAD2, as well as rescued cell migration capacity (Fig. 3f, h). We also explored the impact of cholesterol modulation on the TGF-β pathway using
MβCD, a cyclic oligosaccharide commonly employed to deplete membrane cholesterol31,32. Our results showed that altering cholesterol levels with MβCD did not affect TGFBR1 expression or TGF-β
pathway activity (Supplementary Fig. 4a, b). Additionally, treatment with U18666A, a specific NPC1 cholesterol transport inhibitor33 did not affect TGFBR1 or p-SMAD2 levels at various
concentrations (Supplementary Fig. 4c, d). These results indicate that NPC1 regulates the TGF-β pathway in a manner independent of its cholesterol transport function.
Subsequently, we observed that in PLC/PRF/5 cells with NPC1 overexpression, the protein levels of TGFBR1 were significantly elevated, while the corresponding mRNA levels remained unchanged
(Figs. 3a, 4a). Similarly, in NPC1-knockdown HepG2 and PLC/PRF/5 cells, TGFBR1 protein levels were notably reduced, with no significant changes in mRNA expression (Figs. 3b, 4b and
Supplementary Figs. 3c, 5a). Given that TGF-β receptors undergo constant internalization and recycling, independent of ligand presence34,35,36, our experiments indicated that TGF-β
stimulation did not affect the half-life of the TGFBR1 protein in PLC/PRF/5 and HepG2 cells (Supplementary Fig. 5b, c). Cycloheximide (CHX) chase experiments demonstrated that NPC1
overexpression extended the half-life of TGFBR1 in PLC/PRF/5 cells (Fig. 4c), whereas NPC1 knockdown accelerated its degradation in HepG2 cells (Fig. 4d), underscoring NPC1’s crucial role in
stabilizing TGFBR1 protein levels. To elucidate the sustained dynamics of TGF-β signaling under NPC1 overexpression, we conducted time course experiments. In NPC1-overexpressing PLC/PRF/5
cells, SMAD2 phosphorylation was prolonged over a 24-hour period, whereas attenuation of the signal was observed in control cells (Supplementary Fig. 5e). This suggests that NPC1
overexpression prolongs TGF-β signaling, likely by impairing receptor downregulation.
a, b qPCR analysis of NPC1 and TGFBR1 mRNA levels in NPC1-overexpression PLC/PRF/5 (a) or NPC1-knockdown HepG2 (b) cells. c, d PLC/PRF/5 cells with/without stable overexpression of NPC1 (c)
or HepG2 cells with/without stable knockdown of NPC1 (d) were treated with CHX for indicated times and then analyzed by western blot. e HepG2 cells with or without stable knockdown of NPC1
were treated with vehicle, MG132 (10 μM), or NH4Cl (10 mM) for 12 hours. Cell lysates were subjected to immunoblot with TGFBR1 or NPC1 antibody. f, g TGFBR1-mCherry-His stable overexpression
PLC/PRF/5 (f) and HepG2 (g) cells with or without NPC1 overexpression (f) or knockdown (g) were pretreated with MG132 (10 μM) for 8 hours before collection. Then TGFBR1-mCherry-His was
pulled down by Ni-NTA and immunoblotted with anti-K48-Ubiquitin, anti-K63-Ubiquitin and anti-Ubiquitin antibody. Data are presented as the mean ± s.e.m. n = 3 (a–e) biologically independent
samples. Statistical significance was determined by two-tailed unpaired Student’s t-test (a, b, e) or two-way analysis of variance (ANOVA) (c, d). All experimental data were verified in
three independent experiments. Source data are provided as a Source Data file.
To further investigate the mechanism by which NPC1 regulates TGFBR1 degradation, we examined whether it was mediated by the proteasome or lysosome pathways. Treatment with the proteasome
inhibitor MG132 led to a significant increase in TGFBR1 protein levels, while no such effect was observed with the lysosomal inhibitor NH4Cl in HepG2 and PLC/PRF/5 cells with stable NPC1
knockdown (Fig. 4e and Supplementary Fig. 5d). Quantitative analyses of these immunoblots confirmed that proteasomal degradation is the predominant pathway for TGFBR1 degradation in the
context of NPC1 knockdown (Fig. 4e and Supplementary Fig. 5d). These results suggest that NPC1 promotes TGF-β signaling by preventing proteasome-mediated degradation of TGFBR1.
Furthermore, we examined the ubiquitination of TGFBR1. In PLC/PRF/5 cells, NPC1 overexpression significantly reduced overall TGFBR1 polyubiquitination, whereas NPC1 knockdown in HepG2 cells
had the opposite effect (Fig. 4f, g). Specifically, NPC1 decreased Lys 48-linked polyubiquitination, which is associated with proteasomal degradation, while Lys 63-linked polyubiquitination,
typically involved in non-proteolytic functions, was unaffected (Fig. 4f, g). These data indicate that NPC1 stabilizes TGFBR1 by reducing its proteasomal degradation through inhibition of
Lys 48-linked ubiquitination.
We explored the potential interaction between NPC1 and TGFBR1 through co-immunoprecipitation (Co-IP) assays, which confirmed that ectopic NPC1 binds to TGFBR1 in PLC/PRF/5 and HEK-293T cells
(Fig. 5a and Supplementary Fig. 6a). This interaction was further validated endogenously in PLC/PRF/5 and HepG2 cells (Fig. 5b). To gain insights into the subcellular localization of the
TGFBR1-NPC1 complex, we examined their co-localization patterns. Although prior studies reported that TGFBR1 undergoes sustained internalization and localizes to various cytoplasmic
vesicles, including compartments marked by LAMP1 or caveolin-137,38,39,40, our results revealed that the TGFBR1-NPC1 complex predominantly colocalizes with the lysosomal marker LAMP1 rather
than with caveolin-1 (Fig. 5c, Supplementary Fig. 6b-f). This suggests that, within HCC cells, the TGFBR1-NPC1 complex predominantly resides in lysosomes. Notably, neither overexpression nor
knockdown of NPC1 altered the lysosomal localization of TGFBR1 (Fig. 5c, Supplementary Fig. 6h, j, b, g, i).
a The lysates of PLC/PRF/5 transfected with indicated constructs were subjected to immunoprecipitation with anti-Flag (or GFP) antibody. The immunoprecipitates were then immunoblotted with
anti-GFP (or Flag) antibody. b PLC/PRF/5 and HepG2 cell lysates were subjected to immunoprecipitation with control IgG or anti-NPC1 antibodies. c PLC/PRF/5 cells stably overexpressing
TGFBR1-mCherry-His and NPC1-HA were immunostained with antibodies against HA and LAMP1 to determine the colocalization among TGFBR1, NPC1 and LAMP1 in PLC/PRF/5 cells. Representative images
from three independent experiments are shown; scale bars, 10 µm. d, e A schematic representation of NPC1 (d) or TGFBR1 (e) WT and deletion mutants. f PLC/PRF/5 cells stably overexpressing
TGFBR1-mCherry-His were transfected with various plasmids encoding NPC1-His-Flag or NPC1 deletion mutants as indicated. Cell lysates were subjected to immunoprecipitation with anti-Flag
magnetic beads and immunoblot with mCherry or Flag antibody. g PLC/PRF/5 cells were transfected with various combinations of plasmids encoding NPC1-His-Flag and TGFBR1-Myc or TGFBR1 deletion
mutants as indicated. Cell lysates were subjected to immunoprecipitation with anti-Myc magnetic beads and immunoblot with Flag or Myc antibody. h Immunoblot analysis of TGFBR1 and NPC1
expression in NPC1-knockdown PLC/PRF/5 cells with further overexpression of NPC1, NPC1 (P691S), or NPC1 (Δ692-854). i Transwell assay was performed in cells related to (h); scale bars, 100
μm. j, k TGFBR1-mCherry-His stable overexpression PLC/PRF/5 (j) and HepG2 (k) cells with or without NPC1 overexpression (j) or knockdown (k) were subjected to immunoprecipitation with
anti-His antibody. The lysates and immunoprecipitates were then blotted. Data are presented as the mean ± s.e.m. n = 3 (i) biologically independent samples. Statistical significance was
determined by two-tailed unpaired Student’s t-test (i). All experimental data were verified in three independent experiments. Source data are provided as a Source Data file.
Further mapping of the NPC1-TGFBR1 interaction domain revealed that the amino acid (aa) 692-854 region of NPC1 is responsible for binding to TGFBR1 (Fig. 5d, f). The interaction surface of
TGFBR1 with NPC1 was mapped to its transmembrane domain (Fig. 5e, g). Additionally, the NPC1 (P691S) mutant retained its ability to bind TGFBR1 (Supplementary Fig. 6m). Transwell assays were
employed to examine the functional role of NPC1 truncations and mutants. In PLC/PRF/5 cells with stable NPC1 knockdown, reintroduction of either wild-type NPC1 or NPC1 (P691S) restored
TGFBR1 expression and cell migration, whereas reintroduction of NPC1 (Δ692-854) failed to rescue these phenotypes (Fig. 5h, i). Moreover, ectopic expression of wild-type NPC1 and NPC1
(P691S) significantly promoted cell migration, while NPC1 (Δ616-854) had no effect (Supplementary Fig. 6l), aligning with the observed effects of these mutants on TGFBR1 stability
(Supplementary Fig. 6k). These results suggest that the aa 692-854 region of NPC1 is essential for its role in promoting TGFBR1 stability and cell migration.
Given that SMAD7 recruits the E3 ubiquitin ligases SMURF1 and SMURF2 to TGFBR1, facilitating its ubiquitination and degradation41,42,43, we hypothesized that NPC1 might suppress TGFBR1
ubiquitination by modulating its interaction with SMAD7 or SMURFs. Therefore, we speculated that NPC1 might suppress the ubiquitylation of TGFBR1 via modulating its interaction with SMAD7 or
E3 enzymes. Co-IP assays revealed that NPC1 overexpression reduced the interaction between TGFBR1 and SMAD7, as well as with the E3 ligases SMURF1 and SMURF2, in PLC/PRF/5 cells (Fig. 5j).
Conversely, NPC1 knockdown in HepG2 cells enhanced these interactions (Fig. 5k). Supporting these findings, colocalization studies of SMAD7-EGFP and TGFBR1-mCherry (Supplementary Fig. 7a, b)
showed that in NPC1 knockdown cells, cytoplasmic localization of SMAD7-EGFP increased significantly and colocalized with TGFBR1-mCherry. Further analysis was conducted to determine whether
NPC1 stabilizes TGFBR1 in a SMAD7-dependent manner. Knockdown of SMAD7 or inhibition of SMURF1/2 using siRNA rescued TGFBR1 protein levels in HCC cells with stable NPC1 knockdown
(Supplementary Fig. 7c, d). These results imply that TGFBR1 degradation in NPC1 knockdown cells is driven, at least in part, by the increased recruitment of SMAD7 and SMURFs to TGFBR1.
Collectively, these findings suggest that NPC1 protects TGFBR1 from proteasomal degradation by interacting with it and inhibiting its binding with SMAD7 and SMURFs.
We examined the correlation between NPC1 and TGFBR1 protein levels in 286 pairs of human HCC tissue samples using immunohistochemistry (IHC). Our analysis revealed a significant positive
correlation between NPC1 and TGFBR1 expression (P