Disease-associated b cells and immune endotypes shape adaptive immune responses to sars-cov-2 mrna vaccination in human sle
- Select a language for the TTS:
- UK English Female
- UK English Male
- US English Female
- US English Male
- Australian Female
- Australian Male
- Language selected: (auto detect) - EN
Play all audios:

ABSTRACT Severe acute respiratory syndrome coronavirus 2 mRNA vaccination has reduced effectiveness in certain immunocompromised individuals. However, the cellular mechanisms underlying
these defects, as well as the contribution of disease-induced cellular abnormalities, remain largely unexplored. In this study, we conducted a comprehensive serological and cellular analysis
of patients with autoimmune systemic lupus erythematosus (SLE) who received the Wuhan-Hu-1 monovalent mRNA coronavirus disease 2019 vaccine. Our findings revealed that patients with SLE
exhibited reduced avidity of anti-receptor-binding domain antibodies, leading to decreased neutralization potency and breadth. We also observed a sustained anti-spike response in IgD−CD27−
‘double-negative (DN)’ DN2/DN3 B cell populations persisting during memory responses and with greater representation in the SLE cohort. Additionally, patients with SLE displayed compromised
anti-spike T cell immunity. Notably, low vaccine efficacy strongly correlated with higher values of a newly developed extrafollicular B and T cell score, supporting the importance of
distinct B cell endotypes. Finally, we found that anti-BAFF blockade through belimumab treatment was associated with poor vaccine immunogenicity due to inhibition of naive B cell priming and
an unexpected impact on circulating T follicular helper cells. SIMILAR CONTENT BEING VIEWED BY OTHERS DELAYED GENERATION OF FUNCTIONAL VIRUS-SPECIFIC CIRCULATING T FOLLICULAR HELPER CELLS
CORRELATES WITH SEVERE COVID-19 Article Open access 15 April 2023 THE GERMINAL CENTRE B CELL RESPONSE TO SARS-COV-2 Article 06 December 2021 HUMORAL AND CIRCULATING FOLLICULAR HELPER T CELL
RESPONSES IN RECOVERED PATIENTS WITH COVID-19 Article 13 July 2020 MAIN The deadly coronavirus disease 2019 (COVID-19) pandemic, caused by severe acute respiratory syndrome coronavirus 2
(SARS-CoV-2), created an emergency situation in which mRNA vaccines were trialed in large cohorts of healthy donors (HDs), leading to the eventual approval of these vaccines by the Food and
Drug Administration1,2. The delivery of monovalent mRNA vaccines and subsequent boosters according to a three-dose injection schedule resulted in an effective reduction of severe COVID-19
infections and deaths3, with effectual protection against the ancestral virus and its variants of concern. To date, in response to the emergence of highly contagious and immune-evasive
variants, updated reformulations of mRNA vaccines, such as the Wuhan-Hu-1 (WA.1)/Omicron BA.4/5 bivalent or XBB.1.5 monovalent formulations, have been introduced. The efficacy of mRNA
vaccines has been assessed by investigating both humoral and cellular responses in the healthy population, where they induce prolonged germinal center (GC) activity4,5, the generation of
high-affinity neutralizing antibodies (nAbs) and the establishment of immune memory6,7, as well as de novo B cell engagement upon booster vaccination8,9. While GC activity can be detected at
least up to 6 months after vaccination, the rapid waning of circulating antibodies and nAbs10 suggests that the formation of long-lived plasma cells might be limited11. Correlates of
protection against reinfections and/or severe disease have been proposed to include anti-receptor-binding domain (RBD) titers and antiviral nAbs, as well as persisting memory B and T
cells12. Despite the demonstrated safety and efficacy of SARS-CoV-2 mRNA vaccines in immunocompetent individuals1,2,13, a full understanding of their effectiveness in immunocompromised
persons is still lacking. Overall, previous studies have demonstrated that immunomodulatory drugs can result in poor vaccination responses14 and a higher risk and severity of bacterial and
viral infections15. Yet, there is still a paucity of information about the mechanisms controlling mRNA vaccines’ immunogenicity and long-term efficacy in immunocompromised and autoimmune
patients diagnosed with systemic lupus erythematosus (SLE). Previous studies reported reduced immunogenicity of COVID-19 vaccines in a wide spectrum of autoimmune disorders16, including
SLE17. Largely, those studies addressed mRNA vaccine efficacy in patients with lupus by assessing the seroconversion rate of anti-spike immunoglobulin G (IgG) responses in small-sized
cohorts17,18. To date, the cellular basis of these antibody deficiencies and the impact of anti-B cell therapies other than rituximab-induced B cell depletion have not been addressed. In
this study, we investigated the efficacy of SARS-CoV-2 mRNA vaccinations in patients with SLE, a B cell-induced disease19 with an important cross-talk with functionally abnormal T
cells20,21. Several groups including our own have shown that B cell regulation is profoundly disturbed in SLE, with SLE heterogeneity underpinned by the expression of separate B cell
endotypes22,23. Specifically, we have shown that the expansion of activated effector B cells and plasma cells segregates with more severe disease and may reflect a naive-derived
extrafollicular endotype that is distinct from a GC/memory endotype and is predominant in Black patients with SLE. Notably, severe COVID-19 infections share these characteristics and induce
prominent extrafollicular B cell differentiation and expansion of autoreactive antibody-secreting cells (ASCs)24,25. Here, we show that patients with SLE have reduced antibody titers and IgG
neutralizing activity and lack coordinated activity between the memory T and B cell compartments, with poor vaccine immunogenicity associated with increased extrafollicular immune endotypes
and treatment with belimumab26,27, an anti-BAFF monoclonal antibody approved by the Food and Drug Administration for lupus therapy. RESULTS DONOR COHORT CHARACTERISTICS AND STUDY DESIGN To
study the efficacy of mRNA COVID-19 vaccines in SLE, we enrolled donors who received two (Vax1 + Vax2) or three (Vax3) doses of monovalent (WA.1) BioNTech/Pfizer or mRNA-1273
(Moderna/National Institute of Allergy and Infectious Diseases (NIAID)) vaccines. The cohort consisted of patients with SLE (_n_ = 79 patients; _n_ = 10 prepandemic individuals, _n_ = 69
vaccinees) and age- and sex-matched HD controls (_n_ = 64 HDs; _n_ = 8 prepandemic individuals, _n_ = 56 vaccinees) collected between March 2021 and October 2022. The SLE group was enriched
for female patients of Black ancestry, reflecting the race and sex bias of SLE and the demographics of the Atlanta metropolitan area (Supplementary Table 1). Owing to the restrictions
imposed by the pandemic isolation requirements, the HD group had an underrepresentation of Black individuals relative to the SLE cohort. Samples were mainly cross-sectional collections, with
longitudinal follow-ups as indicated in the diagrams (Supplementary Table 1 and Extended Data Fig. 1). Given that our study was designed to evaluate primary responses to mRNA vaccines, in
the absence of any infection at a time when vaccine administration was erratic, longitudinal follow-up was limited to the fraction of patients who fulfilled these criteria. A total of 256 HD
and 212 SLE samples were serologically evaluated for vaccine-induced antibody responses, and a total of 161 HD and 182 SLE paired peripheral blood mononuclear cell (PBMC) samples were
assessed for antigen-specific B and T cell responses using high-dimensional flow cytometry combining antigen reactivity and deep immune profiling (Extended Data Fig. 2). LOWER SEROCONVERSION
UPON PRIMARY MRNA VACCINATION IN PATIENTS WITH SLE To assess the level of seroconversion in our two cohorts and to define the specificity, kinetics and persistence of circulating antibodies
recognizing different portions of the mRNA-coded proteins, we performed an isotype-specific plasma screen28 against the following SARS-CoV-2 targets: S1 and S2 subunit domains of the spike
protein, RBD of the S1 subunit, and the N-terminal domain (NTD) (Extended Data Fig. 3a). Nucleocapsid-specific IgG antibodies were also tested to exclude prior infections (Extended Data Fig.
3b). Overall, IgM responses were minor contributors to the spike reactivity in the HD cohort and were increased in the SLE cohort (Extended Data Fig. 3c). IgA-specific responses were
largely induced against the spike domain and RBD (Extended Data Fig. 3d), with similar responses between the two groups. As previously reported, we observed a predominant IgG-mediated
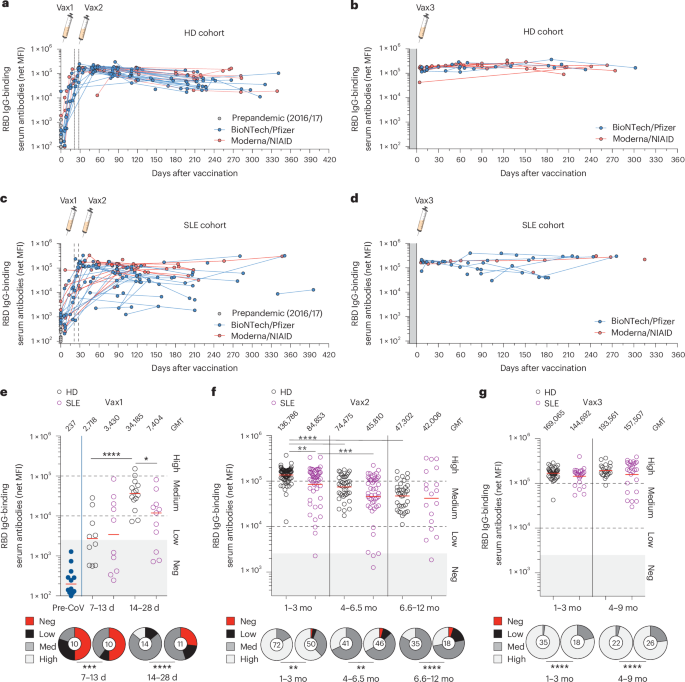
anti-spike and anti-RBD response (Extended Data Fig. 3e and Fig. 1a–g). Upon the administration of one vaccine dose (Vax1, 3–4 weeks), ~85% of HDs seroconverted, whereas patients with SLE
had a lower seroconversion rate of ~58%, with significantly more negative/low responders (Fig. 1e and Extended Data Fig. 3e). Completion of the primary series of vaccines (Vax2) increased
the seroconversion rate of both the SLE (88%) and HD (100%) groups, although reduced mean titers and overall increased number of negative/low responders remained among the vaccinees with SLE
(Fig. 1f and Extended Data Fig. 3e). A booster dose (Vax3) normalized the mean titers of IgG RBD between the two cohorts (Fig. 1g). While the RBD of the S1 subunit has been described as a
main target of broad nAbs, other non-RBD structural proteins of the spike, namely S2 and NTD, can harbor neutralizing epitopes. The S2 domain, harboring more conserved epitopes and some
level of cross-reactivity with other coronaviruses, was targeted by IgG similarly in HD and SLE samples (Extended Data Fig. 3e), whereas the IgG reactivity toward the NTD was lower in the
SLE cohort, potentially compromising the control of viral escape29 (Extended Data Fig. 3e). Preexisting immunity to the four seasonal common-cold coronaviruses (CCCs)—alpha coronavirus
strains ‘HKU1’ and ‘229E’ and beta coronavirus strains ‘OC43’ and ‘NL63’—was similar at baseline, with the only detectable difference being the higher anti-OC43 IgG titers in SLE (Extended
Data Fig. 3f). Whether this observation could be explained by either more frequent or prolonged seasonal infections in patients with SLE remains to be elucidated. Overall, the evaluation of
serological responses to mRNA vaccination revealed a defective primary response in SLE that requires vaccine boosters for full seroconversion. REDUCED RBD-SPECIFIC ANTIBODY COMPETITIVENESS
AND NEUTRALIZATION IN SLE The functional activity of circulating RBD-specific antibodies was determined by a competitive ELISA to assess their efficiency in blocking the interaction of
recombinant human RBD with its receptor, recombinant human angiotensin-converting enzyme 2 (ACE2) (Fig. 2a,b)30. Interestingly, while the overall anti-RBD titers were only mildly reduced in
patients with SLE (Fig. 1), this group displayed significantly impaired ability to block ACE2 binding across most time points (Fig. 2a,b). Despite medium/high RBD IgG titers, SLE samples
were more frequently enriched for either non- or low-competitive antibodies (Fig. 2c), which are usually low-avidity IgG antibodies30,31. To test the hypothesis that impaired ACE2-blocking
activity could result from defective affinity maturation of B cell responses in SLE, we tested antibody avidity using surface plasmon resonance (SPR)32. Comparisons of off-rate values
confirmed that patients with SLE were enriched for anti-RBD immunoglobulins with medium/low avidity, with the greatest impairment observed after Vax2; this was only partially rescued after
the booster dose (Fig. 2d). Of note, at Vax2, the absence of detectable RBD binding (Fig. 2d, nonbinder) was detected exclusively in a fraction of patients with SLE treated with belimumab.
To corroborate the ELISA results further, we performed pseudoviral neutralization assays33 against the SARS-CoV-2 WA.1 (wild-type), Delta (B.1.617.2) and Omicron (B.1.1.529 BA.1) strains
(Extended Data Fig. 4a,b). Patients with SLE displayed impaired neutralization activity against those viruses, with significantly lower neutralization titers and reduced breadth, relative to
their HD counterparts (Fig. 2e–g and Extended Data Fig. 4b). Interestingly, neutralizing titers decayed significantly faster in HDs relative to patients with SLE, with significant
differences for the WA.1 wild-type (half-life of 38 days for the HD group versus 73 days for the SLE group; _P_ = 0.03) and Delta (half-life of 39 versus 68 days; _P_ = 0.03) strains after
Vax3 (day 42 after vaccination and onwards)34. These data identify qualitatively defective and lower-avidity circulating antibodies resulting in reduced breadth of neutralization in patients
with SLE. DEFECTIVE AND DISTINCT ANTI-SPIKE B CELL RESPONSES IN SLE To evaluate the magnitude of cellular responses and the identity of B cells induced upon mRNA vaccination, we performed
immunophenotypic profiling with a high-dimensional 28-color flow panel that provided tetramer-based detection of WA.1 spike- and RBD-reactive B cells (Extended Data Fig. 2a and Fig. 3a,b).
During the post-Vax1 priming phase, 62% of the HDs mounted an early anti-spike B cell response (Fig. 3c), with ~35% of anti-Spike B cells also binding to the RBD tetramer (Fig. 3d). Overall,
the HD group displayed a higher and persistent anti-spike and anti-RBD recall response to Vax2 and Vax3 (Fig. 3c,d). The SLE group had a significantly lower proportion of responders after
priming and within memory recall responses, with ~10–30% of patients failing to generate a detectable B cell response at any time (Fig. 3c,d). B cell lymphopenia is common in SLE owing to
both disease activity and therapy. To account for this variable, we compared the frequencies of the total CD19+ B cells between the HD and SLE groups (Extended Data Fig. 4c). Both total and
antigen-specific circulating B cells were reduced in patients with SLE, with enrichment of patients with very low B cell frequency (<1%) and low spike-reactive B cells (<0.0022%)
(Extended Data Fig. 4c,d). Normalization of antigen-specific reactivity to B cell numbers confirmed that the SLE cohort carried more negative responders than the HD cohort (Extended Data
Fig. 4e,f). Preexisting immunity to CCCs in the B cell memory compartment did not significantly influence the anti-SARS-CoV-2 B cell response, as measured by the level of cross-reactive
WA.1+/CCC+ spike B cells (Extended Data Fig. 5a–c). Furthermore, this response was not notably different between the two cohorts (Extended Data Fig. 5c). Contrary to the greater durability
of their antibody response, the frequency of spike-reactive B cells declined more rapidly in the SLE group after Vax2 (half-life; 95% confidence interval, calculated decay _P_ = 0.009) but
was similar to that in the HD group after Vax3. Together, these results suggest that B cell defects in SLE are responsible for reduced mRNA vaccine efficacy. ANTI-SPIKE CD27− POPULATIONS
PERSIST DURING THE MEMORY PHASE AND EXPAND IN SLE Despite the increasingly recognized complexity of these compartments, previous studies have largely concentrated on plasmablast and CD27+
memory responses. As different effector and memory pathways and the participation of IgD−CD27− double-negative (DN) B cells may be induced in different SLE types24,35, we sought to
interrogate further the expanded pool of antigen-reactive B cells and define their dynamics. The distribution of DN subsets (DN1–DN4) is an indicator of the origin and function of the
corresponding B cells. Specifically, we have previously associated DN1 B cells with conventional CD27+ memory pathways36 and shown that they represent a large majority of DN cells in healthy
individuals. In contrast, DN1 cells represent a much lower fraction in acute SLE and severe COVID-19 infections, in which DN2 and DN3 B cells are dominant. In these acute situations, DN2
and DN3 cells are considered extrafollicular naive-derived effector cells23,24,25,37,38. However, little is known about the contribution of DN subsets to effector and memory vaccination
responses and specifically to mRNA vaccination. Using unsupervised PaCMAP (pairwise controlled manifold approximation) and FlowSOM tools, we determined the complexity of the global B cell
compartment and defined the participation of multiple B cell clusters in the anti-spike/RBD response (Extended Data Fig. 6a and Fig. 4a). In SLE, the major differences were driven by
populations of B cells typically associated with the disease (for example, activated B naive, DN2, DN3 and 9G4-expressing cells24,35; Extended Data Fig. 6a and Fig. 4a). In particular,
within the DN B cells, RBD−spike+ B cells in the SLE group were significantly enriched for DN2/DN3 clusters (#4, 5, 25) over DN1 (cluster #11) (Extended Data Fig. 6a). Increased DN2 and
spike++ DN2 populations were shared among patients with SLE, with greater frequency in those of Black ancestry (Extended Data Fig. 6b). We also used a supervised two-dimensional flow
cytometry approach to measure the distribution of spike-reactive B cells among previously identified parental populations defined by the expression of IgD and CD27: naive, CD27+ unswitched
memory, CD27+ isotype-switched memory and IgD−CD27− DN cells. DN B cells were further fractioned into four specific subsets (DN1–DN4)23,24,39 determined by the expression of CD21 and CD11c
(full gating strategy; Extended Data Fig. 2a and Fig. 4b). The CD20+spike+ B cell responses to Vax1 included in both cohorts similarly large fractions of naive B cells (~40%) that rapidly
contracted over subsequent vaccinations (Fig. 4c). The IgD+ unswitched memory cells also contributed to a small portion of the total antigen-induced population that rapidly contracted (Fig.
4c). The initial priming responses included significant fractions of early CD27+ switched memory cells and DN cells, the latter representing naive-derived effector responses as we had
previously reported for autoreactive B cells in SLE and severe COVID-19 infections25,35,37. Notably, DN cells dominated the spike response early in SLE and remained dominant in both groups
before booster vaccination, presumably reflecting memory cells induced by Vax1 and effector/activated memory cells induced by Vax2 (ref. 40). In both groups, while conventional CD27+ memory
cells dominated the response following booster vaccination, DN cells represented a large fraction of the memory responses (Fig. 4c,d). In this study, DN1 strongly dominated the
spike-specific responses in HDs across all time points. In contrast, in patients with SLE, DN2 cells dominated the early response to Vax1 and Vax2 and remained significantly higher relative
to the HD cohort in the post-Vax3 period (Fig. 4d,e). Moreover, DN2 cells were enriched in low spike responders (below the limit of sensitivity (LOS)) (Fig. 4f). DN3 cells also contributed
to different phases of the response and were significantly expanded at late time points after Vax2 and Vax3 in the SLE group (Fig. 4d). The expression of C–C chemokine receptor type 6 (CCR6)
and C–X–C motif chemokine receptor 3 (CXCR3) on spike-reactive B cells was also qualitatively different between the two cohorts (Fig. 4g–i). In the HD cohort, we observed a predominance of
CCR6+spike+ B cells that expanded within subsequent vaccinations (Fig. 4g–i). In contrast, in patients with SLE, spike+ B cells were highly enriched for CXCR3+ cells (Fig. 4g–i). We further
analyzed the contribution of several B cell isotypes to the anti-spike responses by examining their immunoglobulin surface expression with flow cytometry (Extended Data Fig. 6c–g). IgG
responses dominated the spike reactivity (Extended Data Fig. 6c,d,g), whereas IgM and IgA memory B cells represented a smaller portion of this response (Extended Data Fig. 6c–f).
Interestingly, IgM+ memory B cells were increased in SLE, particularly in the early post-Vax2 and Vax3 phases, accounting for >20% of all antigen-reactive CD20+ B cells in several
patients (Extended Data Fig. 6e). Additionally, in the SLE cohort, spike reactivity was associated with a smaller and delayed expansion of IgG+ B cells upon recall doses (Extended Data Fig.
6g). Collectively, these data indicate that patients with SLE mount a diverse anti-B cell immunity upon mRNA vaccination, with greater expansion of DN2/DN3 B cells also persisting during the
establishment of memory responses. IMPAIRED ACTIVATION AND PERSISTENCE OF ANTI-SPIKE LUPUS T CELLS We also sought to define the magnitude, kinetics and differentiation of CD8+ and CD4+ T
cells upon mRNA vaccination. To this end, we used an in vitro system suitable for scoring the frequency of antigen-reactive T cells and that relies on the incubation of cells with megapools
of peptides and allows their quantification using the activation-induced marker (AIM) assay6,41 (Fig. 5a and Extended Data Fig. 7a,b). Cells were stimulated with megapools of spike
overlapping peptides spanning the entire protein (WA.1, spike aa 5–1,273) or with peptides from the hemagglutinin (HA) H1N1 (A/California/04/2009) protein, an unrelated control for viral T
cell reactivity. Twenty-four hours after incubation, samples were analyzed to score the magnitude of antigen-reactive AIM+ cells using a combination of two surface markers (CD69 and 41BB for
CD8+ T cells and CD40L and OX40 for CD4+ T cells). T helper CD4+ cells were classified based on their expression of chemokine receptors, and their polarization was further investigated in
both the CXCR5− or CXCR5+ (referred to as ‘AIM+ circulating T follicular helper (cTFH)’) compartments (Fig. 5b and Extended Data Fig. 7b). Lower T cell responses were observed in the SLE
cohort, with impaired priming of AIM+CD8+ T cells (Fig. 5c) and lower levels of both AIM+CD8+ and AIM+CD4+ T cells at the late memory and recall phases (Fig. 5c–e and Extended Data Fig.
7c–e). The overall fold reduction in the SLE group compared to the HD group was 6.71 (AIM+CD8+ T cells) and 3.15 (AIM+CD4+ T cells) at Vax2 and 3.85 (AIM+CD8+ T cells) and 2.92 (AIM+CD4+ T
cells) at Vax3. Unsupervised PaCMAP and FlowSOM cluster analyses were informative of significant differences in terms of T cell polarization, with T cells in the SLE cohort characterized by
a reduction in effector memory T (TEM) cell subsets, also expressing CCR4 and/or CCR6 (CD8+ T cell clusters #8 and 12–14, CD4+ T cell clusters #1–3, 7 and 8) (Fig. 5f and Extended Data Fig.
7f,g). Two-dimensional flow cytometry comparisons confirmed that the SLE anti-spike T cell responses were less represented in the TEM pool over three doses of vaccine (Fig. 5g–i) and were
distinguished in their SLE cTFH compartment, with an initial skewing of primed AIM+ cTFH cells into CCR6+ TFH17 cells (Extended Data Fig. 8a) and a general reduction in the magnitude of the
SLE AIM+ cTFH pool upon memory responses, especially after Vax2 (Fig. 5e). Notably, HA-reactive memory T cells were detected at normal levels in patients with SLE (Extended Data Fig. 8b),
although the AIM+ HA CD8+ pool still failed to generate normal TEM cells (Extended Data Fig. 8c), suggesting that CD8+ T cell defects might be mediated by associated lupus-disease defects42.
These results suggest that anti-spike T cell defects in SLE might be largely a result of inefficient mRNA activity and/or a property of vaccine- versus infection-induced T cell immunity.
POOR VACCINE-MEDIATED RESPONSES ASSOCIATE WITH AN SLE EXTRAFOLLICULAR IMMUNE SIGNATURE To investigate the influence of B cell endotypes on different vaccine responses, we used the total
RBD-reactive IgG levels to classify all vaccinees into three groups of responders: negative/low (VNL), medium (VM) or high (VH) vaccine responders (Fig. 6a). As expected, RBD IgG titers
directly correlated with the potency of WA.1 neutralization (Fig. 6b). Vaccinees with SLE who received one or two vaccine doses were enriched for negative/low responders, and their
neutralizing IgG potency upon Vax2 was still significantly lower than that in HDs. While the booster dose improved the responses in the SLE cohort, only 78% reached high antibody titers
relative to 97% in the HD cohort (Fig. 6a). We then tested the hypothesis that, in our SLE cohort, a predisposition to strong extrafollicular immune responses might be responsible for lower
immunogenicity of the mRNA vaccine. To address this question, we assessed patients for circulating cellular surrogates of extrafollicular activity identified in previous studies of SLE and
acute COVID-19 infections25,35,37. Based on these studies, we created an ‘extrafollicular activity score’ that included markers proposed to represent decreased GC activity (low B DN1
frequency) and low activated cTFH (act cTFH, CXCR5+PD-1+CD38+) frequency, together with markers of extrafollicular activation, including increase in B DN2 and circulating plasmablasts, as
well as expansions of CXCR5− peripheral activated T helper (act TPH, CXCR5−PD-1+CD38+) cells43,44 (Fig. 6c and Extended Data Fig. 9a). We observed that higher extrafollicular scores were
indeed associated with VNL groups, with strong overrepresentation of its components in the SLE cohort, where they negatively correlated with vaccine responsiveness (Fig. 6d). Factors
contributing to vaccine responses, such as age, sex or race, did not appear to drive a strong bias in mRNA immunogenicity and vaccine responsiveness (Extended Data Fig. 9b–e). We next asked
whether the qualitative assessment of serological reactivity was correlated to the magnitude of antigen-specific memory B and T cells. A strong correlation was detected between negative and
low antigen-specific B and T cell responses and the VNL group (Fig. 6e–h and Extended Data Fig. 9f,g). Notably, a great lack of immune memory responses in the B and T cell compartments was
uniquely observed in a group of VNL patients with SLE who received two mRNA vaccine doses (Vax2) (Fig. 6e–h and Extended Data Fig. 9f,g). These results confirm defective humoral and cellular
immunity in poor vaccine responders and their association with extrafollicular endotypes. POOR VACCINE RESPONSES AND HIGH EXTRAFOLLICULAR SCORES LINKED TO BAFF INHIBITION IN SLE We next
investigated cellular variables within the different SLE treatment groups. Integrating our immunophenotyping postvaccination data through principal component analysis (PCA), we segregated
the HD and SLE cohorts based on underlying immunological-associated features (Fig. 7a and Extended Data Fig. 10a). The results indicated that the general immune cell composition remained
distinct between the SLE and HD cohorts throughout the vaccine-mediated responses. Overlaying patient metadata onto the PCA plot revealed that patients receiving anti-BAFF therapy
(belimumab) were the most distant group from both HDs and patients with SLE receiving other classes of SLE therapy (Fig. 7a, Extended Data Fig. 10b and Supplementary Table 2). Comparisons of
vaccinated HDs and patients with SLE subgrouped by treatment class confirmed that unique extrafollicular signatures were globally associated with the SLE diagnosis. Features included a
stronger extrafollicular B cell signature with an expansion of activated naive cells, DN2 cells and ASCs (for example, plasma cells) in the B cell compartment, as well as reduced cTFH cells
(Extended Data Fig. 10c–h). The multivariate analysis suggested that not only disease-associated immunophenotype characteristics but also lupus-specific medications might distinguish
vaccine-mediated immune responses. Therefore, we sought to explore whether there was a meaningful correlation between poor vaccine responses and specific SLE treatments. Humoral and cellular
responses were diverse and changed dynamically in each SLE subgroup. Thus, the subgroup of patients with SLE receiving belimumab was enriched for the category of poor vaccine responders
(VNL), whereas the other subgroups (patients receiving mycophenolate mofetil, azathioprine or methotrexate) were similarly distributed among the three vaccine groups, with the
hydroxychloroquine subgroup being overrepresented among good vaccine responders (Fig. 7b–d). Disease activity score (measured as the SELENA-SLEDAI (Safety of Estrogens in Lupus National
Assessment-SLE Disease Activity Index) score) differed significantly between the SLE subgroups, with the lowest score in the hydroxychloroquine group (Extended Data Fig. 10i); however, it
did not seem to influence vaccine-mediated antibody and B cell responses (data not shown). The total RBD-specific IgG levels also reflected the nAb potency and breadth in the SLE subgroups
(Fig. 7e and Extended Data Fig. 10j). From a cellular standpoint, poor responses correlated with a general reduction in total circulating B cells (Extended Data Fig. 10c). The overall
spike-specific B cell responses were largely unaffected in hydroxychloroquine-treated patients across all vaccine doses (Fig. 7f). In contrast, all other treatment subgroups had
significantly impaired responses at Vax1. Notably, subsequent vaccine doses induced normal responses in the group treated with mycophenolate mofetil. Antimetabolite treatments with
azathioprine or methotrexate as well as belimumab treatment induced the poorest levels of response, which remained greatly diminished even after three doses. The belimumab group had the
lowest frequency of spike-specific B cells, albeit not significantly different from the azathioprine/methotrexate group, and contained the largest fraction of patients with spike-specific B
cells below the limit of detection (LOD) (Fig. 7f). From a qualitative standpoint, antigen-specific B cells shifted in all treatment groups except for the belimumab subgroup, from an early
dominance of naive and DN cells to a predominance of CD27+ memory B cells. Consistent with its preferential impact on naive cells relative to memory cells27, belimumab treatment led to the
largest accumulation of CD27+ memory cells (Extended Data Fig. 10k); this is unlikely to depend on enhanced cross-reactivity with the CCCs, which appeared to be proportionally small and not
dissimilar to that in the other groups (Extended Data Fig. 5c). In contrast, DN cells remained the majority of antigen-specific B cells in the azathioprine/methotrexate subgroup after Vax3.
Within the heterogeneous DN compartment (Fig. 7g), there was a gradual increase in the contribution of DN1 responses, which accounted for approximately 50% of all spike+ DN B cells after
three doses in the HD cohort as well as in the hydroxychloroquine and azathioprine/methotrexate SLE subgroups. However, non-DN1 cells represented >75% of spike+ DN cells in the
mycophenolate mofetil and belimumab groups (Fig. 7h). T cell responses were broadly reduced in patients with SLE, with a more pronounced and general loss of CD8 reactivity against the spike
(Extended Data Fig. 10l) and low CD4+ T cell (Extended Data Fig. 10l) and memory cTFH cell (Fig. 7i) responses in the poor B cell responder groups. Overall, the most profound reduction or
lack of vaccine efficiency, measured as a combined activity of serological and cellular-mediated responses, was observed in patients with SLE receiving anti-BAFF treatment at the time of the
initial vaccination (and remained treated over the course of vaccine sample collections); this group contained the largest proportion of nonresponders (Fig. 7j). Notably, consistent with
the preferential impact of belimumab on naive B cell activation and survival, all belimumab-treated patients failed to respond to the priming dose (Fig. 7f) and were characterized by
significantly reduced potency and breadth of neutralization (Fig. 7e and Extended Data Fig. 10j) upon subsequent dosing. Additionally, these patients showed significantly reduced magnitude
of memory antigen-specific B cell (Fig. 7f) and spike-specific cTFH (Fig. 7i) responses. DISCUSSION Clinical efficacy and immune correlates of mRNA vaccination have been amply tested in the
healthy population and in patients with cancer33,45 or solid organ transplantation46,47,48. In contrast, the humoral and cellular responses to these vaccines are poorly understood in
patients with SLE in whom both components can be compromised by the autoimmune disease itself and by multiple immunosuppressive treatments. Our study provides an in-depth antibody and
cellular analysis of a large cohort of patients with SLE, most of whom were of Black ancestry (_n_ = 79, 68% Black). Globally, patients with SLE showed reduced seroconversion rates and a
generalized reduction in ACE2-blocking activity that was uncoupled from anti-RBD IgG titers, suggesting some caution in assessing vaccine efficacy simply based on anti-spike/RBD titers. In
harmony with lower competitiveness, the neutralizing power and breadth of neutralization of the SLE plasma samples were significantly lower than those in the control group even after full
seroconversion. While the mechanistic basis of these qualitative antibody defects remains to be determined, we propose that these features could be explained by defective affinity
maturation, possibly due to aberrant GC activity and/or dominant extrafollicular activity49,50,51. This conclusion is supported by direct SPR measurements of lower avidity of the SLE
anti-spike antibodies. Notably, a slower decline in nAb titers observed after booster vaccination in patients with SLE, an opposite trend to the shorter durability of anti-spike memory B
cell responses, suggests that the lupus milieu may facilitate the generation of long-lived plasma cells and interfere with memory B cell formation. Overall, our study provides new insights
into the impact of abnormal B cell biology on mRNA vaccine responses. We had previously shown that, in Black patients with severe SLE, despite strong preexisting autoimmune memory, disease
flares are characterized by an influx of newly activated naive cells whose differentiation through an extrafollicular pathway generates a large fraction of the ASCs expanded during active
disease24,35. Those studies identified effector DN2 B cells downstream of activated naive B cells, epigenetically poised in SLE to differentiate into ASCs52. From the analysis of
antigen-specific anti-spike B cells, one notable result is the demonstration of the contribution of DN2 cells to both effector and memory responses. This finding indicates the limitations of
ascribing memory function based on phenotypic markers shared by effector cells, including loss of CD21 expression and positive expression of CD11c. Moreover, it strongly suggests the
ability of human extrafollicular responses to generate a separate memory cell compartment, a phenomenon already established in mice. In keeping with the accentuation of the extrafollicular
pathway in severe SLE and its potential contribution to a memory compartment, both components of extrafollicular responses previously described in SLE and severe COVID-19 infections23,25,
DN2 and DN3 cells, dominated the effector phase of the priming response and remained a large part of spike-specific B cells several months after booster vaccination in the absence of
intervening infection. In contrast, DN1 cells, presumed to represent early GC memory24, dominated normal responses across all vaccination time points. Of great interest, within the SLE
cohort, a high extrafollicular index score strongly correlated with lower antibody responses. Combined, our data are consistent with a model that predicts that extrafollicular B cell SLE
endotypes would promote decreased antibody responses with reduced neutralization activity presumably based on defective affinity maturation. Also indicative of the SLE milieu with high
levels of type II interferon in association with enhanced extrafollicular responses53, antigen-reactive B cells in patients with SLE were significantly enriched for CXCR3-bearing cells53.
Conversely, CCR6+ cells devoid of CXCR3 dominated the HD responses, a pattern that could promote an enhanced GC origin of memory cells in normal responses. In contrast, the SLE profile could
promote relocation of tissue CXCR3+ memory cells to sites of viral reinfection. In addition to disease-related determinants, the response to vaccination in SLE is also modulated by
treatment. Previous studies, restricted to antibody assessment, have predictably shown that B cell- and plasma cell-targeting agents used in the treatment of SLE can dampen antibody-mediated
responses and the global B cell pool33,45,54. Other immunomodulatory drugs, such as mycophenolate mofetil, have been shown to reduce vaccine efficacy in some vulnerable populations such as
patients with autoimmune rheumatic diseases16,17 or solid organ transplant recipients46,47. In our SLE cohort, we also observed reduced seroconversion associated with treatment with
mycophenolate mofetil. Yet, in contrast to findings in kidney transplant recipients, the second and third doses were able to rescue the initially deficient responses in these patients55.
This discrepancy can be due to both disease-specific features, the dose of mycophenolate mofetil administered and cotreatments with other potent immunosuppressive drugs. Notably, within the
SLE cohort, the most profound and persistent deficit in vaccine efficacy was observed in patients treated with belimumab, characterized by a reduction in de novo generation of anti-spike B
cells and spike-reactive cTFH cells. Combined, our data suggest that the role of BAFF in the generation of cTFH cells and in the affinity maturation of GC B cells could explain how belimumab
treatment results in poor antibody ACE2 competitiveness, neutralization and breadth potency56,57. Globally, the knowledge acquired in this study should form the basis for new strategies to
enhance the efficacy and durability of mRNA vaccinations, including modifications of vaccine dosing and timing and modulation of the magnitude and/or timing of the administration of
immunosuppressive agents. Our study has some limitations, as our cohorts were not perfectly sex- and race-matched due to the recruitment limitations imposed by the pandemic isolation
requirements and limited access to a broader population of HDs. Nevertheless, we believe that our results could contribute to the understanding of mRNA vaccine responses in general and in
particular in patients with autoimmune diseases and other immune conditions with underlying B cell defects or immunomodulating treatments. METHODS HUMAN PARTICIPANTS This research was
approved by the Emory University Institutional Review Board (Emory IRB nos. IRB000057983 and IRB000058515) and performed in accordance with all relevant guidelines and regulations. Blood
draws were obtained after acquiring written informed consent from the participants. Participants were compensated for their time and interest in the study. Healthy individuals (_n_ = 64) and
patients diagnosed with SLE (_n_ = 79) were recruited from Emory University Hospital, Emory University Hospital Midtown and Emory/Grady (all in Atlanta in the United States). The
demographics of the HD and SLE cohorts and the medications used by patients with SLE are listed in Supplementary Tables 1 and 2. Study data were collected and managed using the REDCap
electronic data capture tool (a secure web platform for building and managing online databases and surveys) hosted at Emory University. All individuals enrolled in this study were considered
naive to SARS-CoV-2 infections based on the absence of self-reported symptoms and/or negative PCR test results. All tested samples were screened for the absence of SARS-CoV-2
nucleocapsid-reactive IgG, and nucleocapsid-positive samples were excluded from the study (Extended Data Fig. 2a,b). PBMC ISOLATION AND SERUM AND PLASMA COLLECTION Peripheral blood samples
were collected in green-top (Vacutainer) sodium heparin tubes. Red-top tubes (Vacutainer) were centrifuged for 10 min at 800_g_ to collect the serum. Undiluted plasma was collected after
centrifugation of the blood for 10 min at 500_g_. Serum and plasma aliquots were stored at −20 °C. Next, blood samples were diluted (1:2) with PBS, and PBMCs were isolated by Ficoll density
gradient centrifugation at 1,000_g_ for 10 min. PBMCs were washed twice with R10 complete medium and lysed with ACK lysis buffer. Viability was assessed using trypan blue exclusion, and live
cells were counted using an automated hemocytometer. Frozen cells were stored at −80 °C in FBS/10% DMSO. FLOW CYTOMETRY PBMCs in frozen vials were thawed, washed and centrifuged at 800_g_
for 5 min and then resuspended in warm R10 complete medium at a final concentration of 20 × 106 cells per ml. Cell suspensions were divided into three parts to perform (1) AIM assays (~1 ×
106 cells), (2) B cell tetramer staining (~4 × 10⁶–8 × 10⁶ cells) and (3) T cell staining (~2 × 10⁶–4 × 10⁶ cells). A mixture of diluted antibodies was prepared in staining buffer (PBS/2%
FCS, 1 mM EDTA) supplemented with Super Bright Complete Staining Buffer and added to the samples in a 96-well round-bottom plate at a final volume of 50 μl per well. After each step,
antibody staining was blocked with a wash in staining buffer (~100 μl) and centrifugation of the plate at 800_g_ for 5 min. For the B cell immunophenotype, after incubation with the
tetramers for 1 h at 4 °C, cells were washed and stained with a mixture of anti-immunoglobulins (anti-IgD + anti-IgM + anti-IgA + anti-IgG) for ~15 min at room temperature (RT) in the dark.
The cells were then incubated with the cocktails of the remaining antibodies for ~40 min at RT in the dark. After washing and centrifugation, cells were stained with L/D Zombie NIR (diluted
at 1:500 in PBS) for 10 min at RT in the dark. Similarly, for the T cell immunophenotype, samples were stained with the antibody mixture for ~40 min at RT in the dark, and viable cells were
detected with L/D Zombie NIR. Cells were resuspended in ~180 μl staining buffer, kept on ice and immediately analyzed on a 5L Cytek Aurora flow cytometer using Cytek SpectroFlo software. The
extrafollicular score was determined by defining ‘normal’ population frequencies ±1 or ±2 s.d. and based on the average flow cytometry values for B DN1 cells, B DN2 cells,
plasmablasts/plasma cells, act cTFH cells and act TPH cells in the HD group, as shown in Extended Data Fig. 9e. The combined score was calculated giving a value of 1 for positivity of each
of the five variables tested for each donor and creating a sum of those positive values to reach a range of 0 (none of the cellular variables fit the extrafollicular score) to 5 (all
cellular variables fit the extrafollicular score) and intermediate values of 1–4, according to the sum. Flow cytometry data were analyzed using FlowJo v10.8.0. DETECTION OF TETRAMER-BINDING
B CELLS Antigen-specific B cells were detected using tetramer probes. Biotinylated spike and RBD proteins (R&D Systems) were multimerized with fluorescently labeled streptavidin (SA) for
1 h at 4 °C. Full-length spike protein was mixed with SA-BV421 using ~100 ng spike and ~20 ng SA for each sample (~4:1 molar ratio). RBD was mixed with SA-AF647 using ~25 ng RBD and ~12.5
ng SA (~4:1 molar ratio). SA-PerCP was used as a decoy probe. After 1 h, all tetramers were mixed in free d-biotin (5 μM, Avidity) to minimize cross-reactivity. PBMCs were incubated for 1 h
at 4 °C with the mixture of tetramers, washed and stained with surface markers, and labeled for viability with L/D Zombie NIR (1:500) for ~10 min before being acquired with the 5L Aurora
(Cytek). AIM ASSAY AIM assay was performed as follows. Briefly, PBMCs were counted and adjusted to 20 × 106 cells per ml in complete medium (RPMI 1640/5% human AB serum supplemented with
GlutaMAX, nonessential amino acids, sodium pyruvate and penicillin–streptomycin). Antigen-specific T cell responses were assessed by incubating 1 × 10⁶ cells with megapools of peptides
(15-mers overlapping by 11 aa) encompassing the sequences of human pathogens: SARS-CoV-2 WA.1 full spike (aa 5–1,273, Miltenyi Biotec) or HA (H1N1, strain swl A/California/04/2009, Miltenyi
Biotec). Cells were incubated in a 96-well U-bottom plate in a final volume of 200 μl. To detect extracellular CD40L expression, we preincubated cells with an anti-human CD40 antibody
(Miltenyi Biotec, pure functional grade, cat. no. 130-094-133) used at 0.5 μg ml−1 for 15 min at 37 °C before stimulation. Cells were then stimulated with each megapool of spike or HA (used
at 1 μg ml−1). Polyclonal stimulation of cells was performed with TCR triggering by staphylococcal enterotoxin B (1 μg ml−1) injection, and the stimulated cells were used as a positive
control. Unstimulated cells at the same density were incubated in complete medium and used as background signals for the quantification of AIM+ cells. Cells were stimulated for ~24 h before
washing and staining for flow cytometry. Cells were analyzed on a 5L Aurora flow cytometer (Cytek). Data in the graphs are shown as background-subtracted (control) values, and negative
values are shown as 0.003 in the log10-scale graphs. ELISA DETECTION OF HUMAN CORONAVIRUS (CCC) IGG To detect IgG antibodies to the four seasonal CCCs, we coated 96-well ELISA half-area
plates (Corning) overnight with 2 μg ml−1 recombinant spike protein from four separate human coronavirus strains (OC43, NL63, 229E and HKU1). Plates were blocked with PBS, 1% casein and 0.1%
Tween 20 for 30 min at RT. Serially diluted (at 1:3 fold) heat-inactivated serum or plasma samples were added for 2 h at RT. After four washes with DPBS/0.1% Tween 20 and 1× DPBS, goat
anti-human IgG-HRP was added to each well (1:5,000 dilution), and plates were incubated for 1 h at RT. Finally, signals were developed with ready-to-use tetramethylbenzidine solution and
stopped with stop solution. Plates were read at 450 nm, and raw optical density (OD) data were expressed as ‘endpoint titers’ using a cutoff value of 0.2. CARBODIIMIDE COUPLING OF
MICROSPHERES TO SARS-COV-2 ANTIGENS AND LUMINEX PROTEOMIC ASSAYS FOR MEASUREMENT OF ANTI-ANTIGEN ANTIBODY This analysis was carried out as previously described. Briefly, five SARS-CoV-2
proteins were coupled to MagPlex microspheres of different regions (Luminex). The nucleocapsid (cat. no. Z03480, expressed in _Escherichia coli_) and S1-RBD (cat. no. Z03483, expressed in
HEK293 cells) proteins were purchased from GenScript. The S1 domain (aa 16–685, cat. no. S1N-C52H2, expressed in HEK293 cells), S1-NTD (aa 13–303, cat. no. S1D-C52H6, expressed in HEK293
cells) and S2 domain (cat. no. S2N-C52H2, expressed in HEK293 cells) proteins were purchased from ACROBiosystems. Each protein was expressed with an N-terminal His6-tag to facilitate
purification (>85% purity) and appeared as a predominant single band on SDS–PAGE analysis. Coupling was carried out at 22 °C following standard carbodiimide coupling procedures. The
concentrations of coupled microspheres were confirmed using a Bio-Rad T20 cell counter. Approximately 50 μl of the mixture of coupled microspheres was added to each well of 96-well
clear-bottom black polystyrene microplates (Greiner Bio-One) at a concentration of 1,000 microspheres per region per well. All wash steps and dilutions were accomplished using 1% BSA/1× PBS
assay buffer. Serum samples were assayed at a 1:500 dilution and surveyed for antibodies to the nucleocapsid, S1, S2, NTD and RBD proteins. After incubation for 1 h in the dark on a plate
shaker at 800 rpm, the wells were washed five times with 100 μl assay buffer using a BioTek 405 TS plate washer and then applied with 3 μg ml−1 PE-conjugated goat anti-human IgA, IgG and/or
IgM (Southern Biotech). After 30 min of incubation at 800 rpm in the dark, the wells were washed three times with 100 μl assay buffer, resuspended in 100 μl assay buffer and analyzed using a
Luminex FLEXMAP 3D instrument (Luminex) running xPONENT 4.3 software at an enhanced photomultiplier tube setting. The MFI using combined or individual detection antibodies (anti-IgA,
anti-IgG or anti-IgM) was measured using the Luminex xPONENT software. The background value of the assay buffer was subtracted from each serum sample result to obtain the net MFI (MFI minus
background) value. RBD COMPETITIVE ELISA ELISA plates (96-well half-area, Corning, #3690) were precoated overnight with 2 μg ml−1 recombinant human ACE2 in PBS at 4 °C. The plates were
blocked with 1% casein for 30 min at 37 °C. Serially diluted plasma and serum samples were mixed with RBD mouse Fc-tagged antigen (Sino Biological, final concentration 20 ng ml−1) for 30 min
at 37 °C, and the mixture was then added to the plates for 30 min at 37 °C. The plates were washed with PBS/0.1% Tween 20, and RBD binding was revealed using secondary goat anti-mouse IgG
(Southern Biotech, #1031-05, 1:5,000 in PBS). The plates were incubated for 30 min at 25 °C; after washing, 40 μl tetramethylbenzidine substrate was added, and developed plates were blocked
with 40 μl stop solution and read at 405 nm with an ELISA reader. The percentage of inhibition was calculated as follows: (1 − (OD sample − OD negative control)/(OD positive control − OD
negative control)) × 100. PSEUDOVIRAL IN VITRO NEUTRALIZATION ASSAY Neutralization activities against the SARS-CoV-2 wild-type (WA.1), Delta (B.1.617.2) and Omicron BA.1 strains were
measured in a single round of infection assay with pseudoviruses, as previously described. Briefly, for the production of the SARS-CoV-2 wild-type, Delta and Omicron pseudoviruses, an
expression plasmid bearing codon-optimized SARS-CoV-2 full-length spike plasmid (parental sequence Wuhan-1, GenBank accession no. MN908947.3) was cotransfected into HEK293T cells (ATCC,
#CRL-11268) with plasmids encoding nonsurface proteins for lentivirus production and a lentiviral backbone plasmid expressing a Luciferase-IRES-ZsGreen reporter, HIV-1 Tat and Rev packing
plasmids (BEI Resources, NR-53818) and pseudoviruses harvested 48 h after transfection; then, titration was performed. Pseudoviruses were mixed with serial dilutions (1:50 to 1:328,050) of
plasma, incubated for 1 h for the reaction at 37 °C in a 5% CO2 incubator and then added to monolayers of ACE2-overexpressing 293T cells (BEI Resources, NR-52511) in duplicate. Forty-eight
hours after infection, cells were lysed, luciferase was activated with the Luciferase Assay System (Bright-Glo, Promega), and the amount of light produced (in relative light units) was
measured on a synergy Biotek reader. Statistical analysis was performed using GraphPad Prism 9.0 for the determination of ID50 (median infectious dose) values through a dose–response curve
fit with nonlinear regression. SPR ANALYSIS OF ANTIBODY BINDING KINETICS TO SARS-COV-2 SPIKE PROTEINS The steady-state equilibrium binding of post-SARS-CoV-2-vaccinated human polyclonal
samples was monitored at 25 °C using a ProteOn SPR system (Bio-Rad). The purified recombinant SARS-CoV-2 spike RBD protein was captured to a GLC sensor chip with 300 resonance units (RU) in
the test flow channels. Serial dilutions (10-, 50- and 250-fold) of freshly prepared samples in BSA–PBST buffer (PBS pH 7.4 with Tween 20 and BSA) were injected at a flow rate of 50 µl min−1
(contact duration 240 s) for association, and disassociation was performed over a 1,200-s interval. Responses from the protein surface were corrected for the response from a mock surface
and for responses from a buffer-only injection. All SPR experiments were performed twice. In these optimized SPR conditions, the variation for each sample in duplicate SPR runs was <7%.
Antibody off-rate constants, which describe the stability of the antigen–antibody complex (that is, the fraction of complexes that decays per second in the dissociation phase), were
determined directly from the interaction of human polyclonal samples with recombinant purified SARS-CoV-2 RBD protein using SPR in the dissociation phase only for sensorgrams with maximum RU
in the range of 10–150 RU and calculated using the Bio-Rad ProteOn manager software for the heterogeneous sample model as previously described. Off-rate constants were determined from two
independent SPR runs. UNSUPERVISED FLOW CYTOMETRY DATA ANALYSIS For high-dimensional visualization of B and T cell flow cytometry data, PBMC samples were downsampled to 200,000 spike++ B
cell and 30,000 AIM+ T cell events. PaCMAP was performed on the samples in https://www.omiq.ai. Unsupervised clustering of PaCMAP populations was done using FlowSOM. Following the initial
quality control exclusion, PBMC samples were used to generate the respective PaCMAP plots. Comparisons of the resulting cluster frequencies were done using the EdgeR plug-in function. PCA
plots were generated in R v3.6.2 (released on 12 December 2019) using the ‘ggbiplot’ library. Custom plotting was performed using the ‘ggplot2’ library for base analysis, and plots were
postprocessed in Adobe Illustrator. Bubble plots were generated in R v4.3.3 (released on 29 February 2024) using the ‘ggplot2’ and ‘dplyr’ libraries. HALF-LIFE AND DURABILITY ANALYSIS Immune
responses, starting 42 days after the second and third mRNA vaccinations, were analyzed using linear mixed-effect models with the log immune response as the dependent variable and time as
the independent variable. Models for patients with SLE, HDs and combined donors included population-level fixed effects and individual-level random intercepts. Statistical significance of
fixed-effect coefficients was assessed using the Wald test. Those with a maximum response less than or equal to the 95th percentile of the baseline and prepandemic samples and data
associated with unexpected greater than twofold increases in NTD IgG were excluded. Models were fit using the lmer function from the lme4 package and the R programming language. STATISTICAL
ANALYSIS Statistical analysis was carried out using Prism v.9.5.1, v.10.2.2 and v10.0.3 (GraphPad Software). For each experiment, the type of statistical testing, summary statistics and
levels of significance can be found in the figures and corresponding legends. Levels of significance are indicated as follows: _*P_ < 0.05, **_P_ < 0.01, ***_P_ < 0.001 and ****_P_
< 0.0001. REPORTING SUMMARY Further information on research design is available in the Nature Portfolio Reporting Summary linked to this article. DATA AVAILABILITY The flow cytometry
dataset is available upon request from the corresponding author. CHANGE HISTORY * _ 02 DECEMBER 2024 A Correction to this paper has been published: https://doi.org/10.1038/s41590-024-02045-y
_ REFERENCES * Baden, L. R. et al. Efficacy and safety of the mRNA-1273 SARS-CoV-2 vaccine. _N. Engl. J. Med._ 384, 403–416 (2021). CAS PubMed Google Scholar * Polack, F. P. et al.
Safety and efficacy of the BNT162b2 mRNA Covid-19 vaccine. _N. Engl. J. Med._ 383, 2603–2615 (2020). CAS PubMed Google Scholar * Thompson, M. G. et al. Effectiveness of Covid-19 vaccines
in ambulatory and inpatient care settings. _N. Engl. J. Med._ 385, 1355–1371 (2021). CAS PubMed Google Scholar * Kim, W. et al. Germinal centre-driven maturation of B cell response to
mRNA vaccination. _Nature_ 604, 141–145 (2022). CAS PubMed PubMed Central Google Scholar * Röltgen, K. et al. Immune imprinting, breadth of variant recognition, and germinal center
response in human SARS-CoV-2 infection and vaccination. _Cell_ 185, 1025–1040 (2022). PubMed PubMed Central Google Scholar * Mudd, P. A. et al. SARS-CoV-2 mRNA vaccination elicits a
robust and persistent T follicular helper cell response in humans. _Cell_ 185, 603–613 (2022). CAS PubMed Google Scholar * Zhang, Z. et al. Humoral and cellular immune memory to four
COVID-19 vaccines. _Cell_ 185, 2434–2451 (2022). CAS PubMed PubMed Central Google Scholar * Rodda, L. B. et al. Imprinted SARS-CoV-2-specific memory lymphocytes define hybrid immunity.
_Cell_ 185, 1588–1601 (2022). CAS PubMed PubMed Central Google Scholar * Alsoussi, W. B. et al. SARS-CoV-2 Omicron boosting induces de novo B cell response in humans. _Nature_ 617,
592–598 (2023). CAS PubMed Google Scholar * Muecksch, F. et al. Increased memory B cell potency and breadth after a SARS-CoV-2 mRNA boost. _Nature_ 607, 128–134 (2022). CAS PubMed
PubMed Central Google Scholar * Nguyen, D. C. et al. COVID-19 and plasma cells: is there long-lived protection? _Immunol. Rev._ 309, 40–63 (2022). CAS PubMed PubMed Central Google
Scholar * Goldblatt, D., Alter, G., Crotty, S. & Plotkin, S. A. Correlates of protection against SARS-CoV-2 infection and COVID-19 disease. _Immunol. Rev._ 310, 6–26 (2022). CAS PubMed
Google Scholar * Thomas, S. J. et al. Safety and efficacy of the BNT162b2 mRNA Covid-19 vaccine through 6 months. _N. Engl. J. Med._ 385, 1761–1773 (2021). CAS PubMed Google Scholar *
Tang, W., Askanase, A. D., Khalili, L. & Merrill, J. T. SARS-CoV-2 vaccines in patients with SLE. _Lupus Sci. Med._ 8, e000479 (2021). PubMed Google Scholar * Mathian, A., Pha, M.
& Amoura, Z. Lupus and vaccinations. _Curr. Opin. Rheumatol._ 30, 465–470 (2018). PubMed Google Scholar * Furer, V. et al. Immunogenicity and safety of the BNT162b2 mRNA COVID-19
vaccine in adult patients with autoimmune inflammatory rheumatic diseases and in the general population: a multicentre study. _Ann. Rheum. Dis._ 80, 1330–1338 (2021). CAS PubMed Google
Scholar * Moyon, Q. et al. BNT162b2 vaccine-induced humoral and cellular responses against SARS-CoV-2 variants in systemic lupus erythematosus. _Ann. Rheum. Dis._ 81, 575–583 (2022). CAS
PubMed Google Scholar * Boedecker-Lips, S. C., Claßen, P., Kraus, D. & Weinmann-Menke, J. Belimumab is not associated with COVID-19 mRNA vaccination failure in systemic lupus
erythematosus. _Rheumatology (Oxford)_ 62, e34–e35 (2023). PubMed Google Scholar * Sanz, I. & Lee, F. E.-H. B cells as therapeutic targets in SLE. _Nat. Rev. Rheumatol._ 6, 326–337
(2010). CAS PubMed PubMed Central Google Scholar * Ahmed, R., Ford, M. L. & Sanz, I. Regulation of T and B cell responses to chronic antigenic stimulation during infection,
autoimmunity and transplantation. _Immunol. Rev._ 292, 5–8 (2019). CAS PubMed Google Scholar * Faliti, C. E. et al. P2X7 receptor restrains pathogenic Tfh cell generation in systemic
lupus erythematosus. _J. Exp. Med._ 216, 317–336 (2019). CAS PubMed PubMed Central Google Scholar * Suurmond, J. et al. Patterns of ANA+ B cells for SLE patient stratification. _JCI
Insight_ 4, e127885 (2019). PubMed PubMed Central Google Scholar * Jenks, S. A. et al. B cell subset composition segments clinically and serologically distinct groups in chronic cutaneous
lupus erythematosus. _Ann. Rheum. Dis._ 80, 1190–1200 (2021). CAS PubMed Google Scholar * Jenks, S. A. et al. Distinct effector B cells induced by unregulated Toll-like receptor 7
contribute to pathogenic responses in systemic lupus erythematosus. _Immunity_ 49, 725–739 (2018). CAS PubMed PubMed Central Google Scholar * Woodruff, M. C. et al. Extrafollicular B
cell responses correlate with neutralizing antibodies and morbidity in COVID-19. _Nat. Immunol._ 21, 1506–1516 (2020). PubMed PubMed Central Google Scholar * Sanz, I., Yasothan, U. &
Kirkpatrick, P. Belimumab. _Nat. Rev. Drug Discov._ 10, 335–336 (2011). CAS PubMed Google Scholar * Ramsköld, D. et al. B cell alterations during BAFF inhibition with belimumab in SLE.
_EBioMedicine_ 40, 517–527 (2019). PubMed Google Scholar * Haddad, N. S. et al. One-stop serum assay identifies COVID-19 disease severity and vaccination responses. _Immunohorizons_ 5,
322–335 (2021). CAS PubMed Google Scholar * Beaudoin-Bussières, G. et al. A Fc-enhanced NTD-binding non-neutralizing antibody delays virus spread and synergizes with a nAb to protect mice
from lethal SARS-CoV-2 infection. _Cell Rep._ 38, 110368 (2022). PubMed PubMed Central Google Scholar * Piccoli, L. et al. Mapping neutralizing and immunodominant sites on the SARS-CoV-2
spike receptor-binding domain by structure-guided high-resolution serology. _Cell_ 183, 1024–1042 (2020). CAS PubMed PubMed Central Google Scholar * Liu, H. et al. Cross-neutralization
of a SARS-CoV-2 antibody to a functionally conserved site is mediated by avidity. _Immunity_ 53, 1272–1280 (2020). CAS PubMed PubMed Central Google Scholar * Ravichandran, S. et al.
SARS-CoV-2 immune repertoire in MIS-C and pediatric COVID-19. _Nat. Immunol._ 22, 1452–1464 (2021). CAS PubMed Google Scholar * Nooka, A. K. et al. Determinants of neutralizing antibody
response after SARS CoV-2 vaccination in patients with myeloma. _J. Clin. Oncol._ 40, 3057–3064 (2022). CAS PubMed PubMed Central Google Scholar * Cohen, K. W. et al. Longitudinal
analysis shows durable and broad immune memory after SARS-CoV-2 infection with persisting antibody responses and memory B and T cells. _Cell Rep. Med._ 2, 100354 (2021). CAS PubMed PubMed
Central Google Scholar * Tipton, C. M. et al. Diversity, cellular origin and autoreactivity of antibody-secreting cell population expansions in acute systemic lupus erythematosus. _Nat.
Immunol._ 16, 755–765 (2015). CAS PubMed PubMed Central Google Scholar * Wei, C. et al. A new population of cells lacking expression of CD27 represents a notable component of the B cell
memory compartment in systemic lupus erythematosus. _J. Immunol._ 178, 6624–6633 (2007). CAS PubMed Google Scholar * Woodruff, M. C. et al. Dysregulated naive B cells and de novo
autoreactivity in severe COVID-19. _Nature_ 611, 139–147 (2022). CAS PubMed PubMed Central Google Scholar * Sachinidis, A. & Garyfallos, A. Double negative (DN) B cells: a connecting
bridge between rheumatic diseases and COVID-19? _Mediterr. J. Rheumatol._ 32, 192–199 (2021). PubMed PubMed Central Google Scholar * Allard-Chamard, H. et al. Extrafollicular
IgD−CD27−CXCR5−CD11c− DN3 B cells infiltrate inflamed tissues in autoimmune fibrosis and in severe COVID-19. _Cell Rep._ 42, 112630 (2023). CAS PubMed PubMed Central Google Scholar *
Lau, D. et al. Low CD21 expression defines a population of recent germinal center graduates primed for plasma cell differentiation. _Sci. Immunol._ 2, eaai8153 (2017). PubMed PubMed Central
Google Scholar * Bowyer, G. et al. Activation-induced markers detect vaccine-specific CD4+ T cell responses not measured by assays conventionally used in clinical trials. _Vaccines
(Basel)_ 6, 50 (2018). CAS PubMed Google Scholar * McKinney, E. F., Lee, J. C., Jayne, D. R. W., Lyons, P. A. & Smith, K. G. C. T-cell exhaustion, co-stimulation and clinical outcome
in autoimmunity and infection. _Nature_ 523, 612–616 (2015). CAS PubMed PubMed Central Google Scholar * Bocharnikov, A. V. et al. PD-1hiCXCR5− T peripheral helper cells promote B cell
responses in lupus via MAF and IL-21. _JCI Insight_ 4, e130062 (2019). PubMed PubMed Central Google Scholar * Law, C. et al. Interferon subverts an AHR–JUN axis to promote CXCL13+ T cells
in lupus. _Nature_ 631, 857–866 (2024). CAS PubMed Google Scholar * Chang, A. et al. Humoral responses against SARS-CoV-2 and variants of concern after mRNA vaccines in patients with
non-Hodgkin lymphoma and chronic lymphocytic leukemia. _J. Clin. Oncol._ 40, 3020–3031 (2022). CAS PubMed PubMed Central Google Scholar * Lederer, K. et al. Germinal center responses to
SARS-CoV-2 mRNA vaccines in healthy and immunocompromised individuals. _Cell_ 185, 1008–1024 (2022). CAS PubMed PubMed Central Google Scholar * Bassi, J. et al. Poor neutralization and
rapid decay of antibodies to SARS-CoV-2 variants in vaccinated dialysis patients. _PLoS ONE_ 17, e0263328 (2022). CAS PubMed PubMed Central Google Scholar * Kantauskaite, M. et al.
Intensity of mycophenolate mofetil treatment is associated with an impaired immune response to SARS-CoV-2 vaccination in kidney transplant recipients. _Am. J. Transpl._ 22, 634–639 (2022).
CAS Google Scholar * Lee, S. K. et al. Interferon-γ excess leads to pathogenic accumulation of follicular helper T cells and germinal centers. _Immunity_ 37, 880–892 (2012). CAS PubMed
Google Scholar * Vinuesa, C. G., Sanz, I. & Cook, M. C. Dysregulation of germinal centres in autoimmune disease. _Nat. Rev. Immunol._ 9, 845–857 (2009). CAS PubMed Google Scholar *
Elsner, R. A. & Shlomchik, M. J. Germinal center and extrafollicular B cell responses in vaccination, immunity, and autoimmunity. _Immunity_ 53, 1136–1150 (2020). CAS PubMed PubMed
Central Google Scholar * Scharer, C. D. et al. Epigenetic programming underpins B cell dysfunction in human SLE. _Nat. Immunol._ 20, 1071–1082 (2019). CAS PubMed PubMed Central Google
Scholar * Zumaquero, E. et al. IFNγ induces epigenetic programming of human T-bethi B cells and promotes TLR7/8 and IL-21 induced differentiation. _eLife_ 8, e41641 (2019). PubMed PubMed
Central Google Scholar * Apostolidis, S. A. et al. Cellular and humoral immune responses following SARS-CoV-2 mRNA vaccination in patients with multiple sclerosis on anti-CD20 therapy.
_Nat. Med._ 27, 1990–2001 (2021). CAS PubMed PubMed Central Google Scholar * Werbel, W. A. et al. Persistent SARS-CoV-2-specific immune defects in kidney transplant recipients following
third mRNA vaccine dose. _Am. J. Transplant._ 23, 744–758 (2023). PubMed PubMed Central Google Scholar * Goenka, R. et al. Local BLyS production by T follicular cells mediates retention
of high affinity B cells during affinity maturation. _J. Exp. Med._ 211, 45–56 (2014). CAS PubMed PubMed Central Google Scholar * Vora, K. A. et al. Cutting edge: germinal centers formed
in the absence of B cell-activating factor belonging to the TNF family exhibit impaired maturation and function. _J. Immunol._ 171, 547–551 (2003). CAS PubMed Google Scholar Download
references ACKNOWLEDGEMENTS We thank all the donors for their generosity in participating in this research and making this study possible. We thank the nurses, staff and providers in the
Emory Clinics and Hospitals in Atlanta, GA. We also thank the members of the Sanz and Lee laboratories for helpful discussions. We would also like to thank the Sanz/Lee clinical coordination
and sample processing teams for sample identification, scheduling and collection. We thank K.S. Bonham for helpful discussions on biostatistical analyses. Finally, we would like to thank D.
Corti, L. Piccoli and J. Bassi for helping with the delineation of the ELISA blocking protocol. This work was supported by the National Institutes of Health grants U54-762 CA260563-01 Emory
SeroNet (I.S., F.E.-H.L.) and U19-AI110483 Emory Autoimmunity Center of Excellence (I.S.). The SPR-based antibody measurement was supported by the Food and Drug Administration’s Perinatal
Health Center of Excellence (PHCE) project grants #GCBER005 and #GCBER008 to S.K. The content of this publication does not necessarily reflect the views or policies of the Department of
Health and Human Services, nor does mention of trade names, commercial products or organizations imply endorsement by the US government. Opinions, interpretations, conclusions and
recommendations are those of the authors and are not necessarily endorsed by the US government. AUTHOR INFORMATION AUTHORS AND AFFILIATIONS * Department of Medicine, Division of
Rheumatology, Lowance Center for Human Immunology, Emory University, Atlanta, GA, USA Caterina E. Faliti, Trinh T. P. Van, Fabliha A. Anam, Sabeena Y. Usman, Matthew C. Woodruff, Daniel
Sanz, Midushi Ghimire, Weirong Chen, Jennifer Hom, Christopher M. Tipton, Eliver Ghosn, Arezou Khosroshahi & Ignacio Sanz * Emory Autoimmunity Center of Excellence, Emory University,
Atlanta, GA, USA Caterina E. Faliti, Trinh T. P. Van, Fabliha A. Anam, Sabeena Y. Usman, Matthew C. Woodruff, Daniel Sanz, Midushi Ghimire, Weirong Chen, Jennifer Hom, Christopher M. Tipton,
Arezou Khosroshahi & Ignacio Sanz * Department of Pathology and Laboratory Medicine, Emory University School of Medicine, Atlanta, GA, USA Narayanaiah Cheedarla, Suneethamma Cheedarla,
Andrew S. Neish & John D. Roback * Department of Microbiology and Immunology, Emory University School of Medicine, Atlanta, GA, USA M. Elliott Williams & Christopher D. Scharer *
Division of Viral Products, Center for Biologics Evaluation and Research (CBER), Food and Drug Administration, Silver Spring, MD, USA Ashish Kumar Mishra & Surender Khurana * Dotmatics,
Inc., Boston, MA, USA Geoff Kraker * Division of Pulmonary, Allergy, Critical Care and Sleep Medicine, Department of Medicine, Emory University, Atlanta, GA, USA Martin C. Runnstrom, Shuya
Kyu, Andrea Morrison-Porter, Hannah Quehl, Natalie S. Haddad & F. Eun-Hyung Lee * Department of Biology, Emory University, Atlanta, GA, USA Hasan Ahmed & Rustom Antia * MicroB-plex,
Inc., Atlanta, GA, USA Natalie S. Haddad * BioMed X Institute, Heidelberg, Germany John M. Lindner Authors * Caterina E. Faliti View author publications You can also search for this author
inPubMed Google Scholar * Trinh T. P. Van View author publications You can also search for this author inPubMed Google Scholar * Fabliha A. Anam View author publications You can also search
for this author inPubMed Google Scholar * Narayanaiah Cheedarla View author publications You can also search for this author inPubMed Google Scholar * M. Elliott Williams View author
publications You can also search for this author inPubMed Google Scholar * Ashish Kumar Mishra View author publications You can also search for this author inPubMed Google Scholar * Sabeena
Y. Usman View author publications You can also search for this author inPubMed Google Scholar * Matthew C. Woodruff View author publications You can also search for this author inPubMed
Google Scholar * Geoff Kraker View author publications You can also search for this author inPubMed Google Scholar * Martin C. Runnstrom View author publications You can also search for this
author inPubMed Google Scholar * Shuya Kyu View author publications You can also search for this author inPubMed Google Scholar * Daniel Sanz View author publications You can also search
for this author inPubMed Google Scholar * Hasan Ahmed View author publications You can also search for this author inPubMed Google Scholar * Midushi Ghimire View author publications You can
also search for this author inPubMed Google Scholar * Andrea Morrison-Porter View author publications You can also search for this author inPubMed Google Scholar * Hannah Quehl View author
publications You can also search for this author inPubMed Google Scholar * Natalie S. Haddad View author publications You can also search for this author inPubMed Google Scholar * Weirong
Chen View author publications You can also search for this author inPubMed Google Scholar * Suneethamma Cheedarla View author publications You can also search for this author inPubMed Google
Scholar * Andrew S. Neish View author publications You can also search for this author inPubMed Google Scholar * John D. Roback View author publications You can also search for this author
inPubMed Google Scholar * Rustom Antia View author publications You can also search for this author inPubMed Google Scholar * Jennifer Hom View author publications You can also search for
this author inPubMed Google Scholar * Christopher M. Tipton View author publications You can also search for this author inPubMed Google Scholar * John M. Lindner View author publications
You can also search for this author inPubMed Google Scholar * Eliver Ghosn View author publications You can also search for this author inPubMed Google Scholar * Surender Khurana View author
publications You can also search for this author inPubMed Google Scholar * Christopher D. Scharer View author publications You can also search for this author inPubMed Google Scholar *
Arezou Khosroshahi View author publications You can also search for this author inPubMed Google Scholar * F. Eun-Hyung Lee View author publications You can also search for this author
inPubMed Google Scholar * Ignacio Sanz View author publications You can also search for this author inPubMed Google Scholar CONTRIBUTIONS C.E.F. and I.S. conceived and directed the study.
C.E.F. processed samples and performed most of the experiments and data analyses. T.T.P.V. helped in performing flow cytometry, 10X Genomics single-cell RNA sequencing and sample
organization. T.T.P.V. and M.G. helped in running ELISA. C.E.F. and M.G. generated some figure representations with R. M.C.W. performed PCA. H.A. performed between-cohort comparisons of the
half-life and durability of antibody- and cellular-mediated fold-change responses. M.C.R. and F.E.-H.L. provided data from healthy controls tested for viral antigens. N.C. and S.C. performed
pseudoviral in vitro tests with plasma samples. F.A.A., N.S.H., A.M.-P. and H.Q. performed serum Luminex screening against viral antigens. A.K.M. and K.S. performed SPR experiments. J.M.L.,
C.M.T., J.H., M.E.W. and C.D.S. assisted with B cell analyses. G.K. and E.G. helped with unsupervised analyses. S.Y.U. and A.K. conducted chart review, identified patient samples for study
inclusion and provided donors’ information. D.S., S.K. and F.E.-H.L. coordinated the processing of samples from healthy donors and the biobank repository. W.C., A.S.N., J.D.R. and R.A.
participated in manuscript review. C.E.F. and I.S. wrote the manuscript, with all authors providing input and editorial support. CORRESPONDING AUTHOR Correspondence to Ignacio Sanz. ETHICS
DECLARATIONS COMPETING INTERESTS F.E.-H.L. is the founder of MicroB-plex, Inc., and has research grants with Genentech. I.S. has research grants with Glaxo Smith Kline. The other authors
declare no competing interests. PEER REVIEW PEER REVIEW INFORMATION _Nature Immunology_ thanks the anonymous reviewers for their contribution to the peer review of this work. Peer reviewer
reports are available. Primary Handling Editor: L.A. Dempsey, in collaboration with the _Nature Immunology_ team. ADDITIONAL INFORMATION PUBLISHER’S NOTE Springer Nature remains neutral with
regard to jurisdictional claims in published maps and institutional affiliations. EXTENDED DATA EXTENDED DATA FIG. 1 STUDY COHORTS’ SAMPLES AND TIMELINE OF SAMPLES’ COLLECTION. A, Study
design, vaccine administration scheme, and time points collected after SARS-CoV-2 mRNA vaccination for healthy controls and patients with SLE. B, Diagrams showing the longitudinal collection
of blood draws from HD and SLE enrolled in the study (circles) and pre-pandemic controls (Pre-CoV, squares). The SLE cohort is grouped for the main treatment by colored circles: Untreated
(none, black), Hydroxychloroquine (HCQ, yellow), Azathioprine (AZA, red), Methotrexate (MTX, dark red), Mycophenolate Mofetil (MMF, dark blue), Belimumab (BLM, turquoise). EXTENDED DATA FIG.
2 HIGH-DIMENSIONAL FLOW CYTOMETRY CHARACTERIZATION OF B AND T CELLS. A, Representative gating strategy for the quantification of CD19+ B cells, their subsets, and tetramer-based reactivity
detection for spike and RBD by flow cytometry. B, Representative gating strategy for quantification of CD3+ T cells, and their CD4s and CD8s populations and subsets by flow cytometry.
EXTENDED DATA FIG. 3 DETECTION OF CIRCULATING ANTIGEN-SPECIFIC IGS ANTIBODIES UPON VACCINATION. A, Cartoon showing the Luminex bead-based assay. B, Nucleocapsid IgG threshold used to define
SARS-CoV-2 negative samples. Each dot represents a sample tested. Boxplots represent min to max and show all points. Statistics was calculated with non-parametric Kruskal-Wallis with Dunn’s
multiple comparisons C, IgM and D, IgA reactivity to the SARS-CoV-2 proteins NTD, S2, S1 and RBD and percentage of responders in HD and SLE. Each dot represents a sample tested. Negative
values are based on MFI values of time 0 (T0) from pre-pandemic and vaccine baseline samples, and are indicated below the gray area. Percentage of positive responders above the gray area is
shown as a numberical value above each tested time-point E, Kinetics analyses for IgG binding to S1, RBD, S2, and NTD proteins by Luminex assay. Overlay of geometric mean and pie charts
showing the proportion of negative, low, medium, or high values. Statistics of the geomean between HD and SLE were performed with two-sided U Mann Whitney for comparison of each indicated
time. Pie chart comparison statistics performed with Chi-square with Fisher test analysis. F, ELISA detection of IgG reactive to beta-common cold coronaviruses (beta-CoV) HKU-1 and OC43 and
alpha-common cold coronaviruses (alpha-CoV) NL63 and 229E, tested with sera from pre-vaccinated (baseline) donors enrolled in the study. Boxplots represent median with interquartile range,
and whiskers indicate range. Each dot represents a tested sera sample from n = 8 HD and n = 9 SLE at baseline. Statistical comparison was performed with unpaired t-test. Not significant, ns
p > 0.05; *p < 0.05; **p < 0.01; ***p < 0.001; ****p < 0.0001. EXTENDED DATA FIG. 4 DETECTION OF CIRCULATING NEUTRALIZING IGS UPON VACCINATION AND QUANTITATION OF ANTI-SPIKE B
CELLS. A, Cartoon showing the steps of pseudoviral _in vitro_ neutralization assay. B, NT50 values detected from HD and SLE plasma and comparison of all viral strains for each sample. Fold
changes show the difference between Delta and Omicron compared to the WT values. C, Circulating CD19+ B cells frequency comparison in our cohorts. D, Correlation of CD19+ frequency and spike
reactive B cells in HD and SLE for each vaccine time point. Blue lines show the range observed in the HD. Pearson analysis was performed for each comparison. Quantification of total (E)
spike-specific and (F) RBD-specific B cells shown as the frequency of viable lymphocytes in the HD and SLE cohorts. Each dot represents an individual sample tested at baseline (d0) and after
receiving one (Vax 1), two (Vax 2), or three (Vax 3) vaccine doses. Pie charts comparisons and Chi-square with Fisher’s test are shown. When indicated, LOD=limit of detection set to
logarithmic 0.001 for B cells and 0.003 for T cells. LOS=limit of sensitivity, based on median values of baseline + 2 x SD. *p < 0.05; **p < 0.01; ***p < 0.001; ****p < 0.0001.
EXTENDED DATA FIG. 5 IMMUNITY TO THE FOUR SEASONAL CCCS. A, Representative gating strategy to score the frequency of Spike-reactive B cells and their binding to the four CCCs Spikes and
cross-reactivity with WA.1 Spike by flow cytometry. B, Quantitation of CCCs cross-reactive memory B cells with WA.1 reactive Spike B cells from PBMC samples collected during mRNA vaccination
(Vax 1 + 2 + 3). C, Quantitation of CCCs cross-reactive memory B cells with WA.1 reactive Spike CD27+ Bmem cells from PBMC samples collected during mRNA vaccination (Vax 1 + 2 + 3). SLE
patients treated with Belimumab (SLE/BLM) are shown in teal color. Each dot represents an individual sample. Statistical comparison performed with unpaired, two-sided Mann-Whitney U test.
Not significant, ns p > 0.05; *p < 0.05. EXTENDED DATA FIG. 6 UNSUPERVISED PACMAP AND FLOWSOM ANALYSIS OF ANTI-SPIKE B AND QUANTITATION OF SURFACE IGM, IGA AND IGG EXPRESSION. A,
Spike++ B cells, EdgeR comparison and significance of low vs high represented clusters in SLE vs HD. B, Frequency of DN2 (left graph) and Spike++ DN2 B cells (right graph) from all subjects
enrolled in the study, divided by race (AA/Black vs others). Each dot represents an individual sample. For the DN2, horizontal lines are means and statistics was calculated with
Kruskal-Wallis with Dunn’s multiple comparisons. For the Spike++ DN2, horizontal lines are medians and statistics was calculated with Unpaired T test. C, Representative flow detection of Ig
surface expression on B cells. D, Distribution of IgM, IgG and IgA and Chi-square (Fisher) comparison. Frequency of membrane-bound E, IgM, F, IgA and G, IgG in HD and SLE spike+ B cells
showed for each vaccine time point as shown in (D). Each dot represents an individual sample. The overlay of the median signals for HD and SLE is shown for each Ig tested. One-way ANOVA test
is shown within the HD or SLE groups. Not significant, ns p > 0.05; *p < 0.05; **p < 0.01; ***p < 0.001; ****p < 0.0001. EXTENDED DATA FIG. 7 UNSUPERVISED PACMAP AND FLOWSOM
ANALYSIS OF ANTI-SPIKE T CELLS AND AIM ASSAY. A, Cartoon showing the AIM assay. B, Representative flow plots and gating strategies used to define AIM+ T cells and their differentiation. C-E
Overlay graphs showing the geometric mean values of the groups are shown for C, AIM+ CD8, D, AIM+ CD4 and E, AIM+ Tfh. Below each graph, the pie charts represent the proportion of negative
and positive responders at each indicated time-point. Vax time points in the figures (c-e) indicate the following binned Time-Points (T) and as indicated in the Extended Data Fig. 1a: 0 (T0,
baseline), 1 (T1-3), 2 (T4-5), 3 (T6-7), 4 (T8-9), 5 (B1-5) and 6 (B6-9). The Chi-Square test was performed to define significance in c, d and e. F, Spike++ AIM+ CD8 T cells, EdgeR
comparison and significance of low vs high represented clusters in SLE vs HD. G, Spike++ AIM+ CD4 T cells, EdgeR comparison and significance of low vs high represented clusters in SLE vs HD.
EdgeR comparisons and significance (expressed as FDR) was generated with ‘omiq.ai’. All cluster’s names were compiled by using the surface markers’ expression as indicated in the relative
heatmap. Not significant, ns p > 0.05; *p < 0.05; **p < 0.01; ***p < 0.001; ****p < 0.0001. EXTENDED DATA FIG. 8 ANALYSIS OF ANTIGEN-SPECIFIC T CELL RESPONSES TO SPIKE AND HA
PROTEINS. A, Frequency of AIM+ cTfh17 upon Vax1, 2 or 3. Each dot represents an individual sample collected at the indicated time-points. Boxplots represent min to max and show all points.
Sample from HD (Vax1, n = 18; Vax2, n = 49; Vax3, n = 47) and SLE (Vax1, n = 18; Vax2, n = 67;Vax3, n = 34). B, Reactivity towards the HA MP for all tested samples, and comparison of HD and
SLE. C, Differentiation of AIM+ HA T cells based on CD45RA and CCR7 expression. Not significant, ns p > 0.05; *p < 0.05; **p < 0.01; ***p < 0.001; ****p < 0.0001. EXTENDED
DATA FIG. 9 CLINICAL, DEMOGRAPHICS, AND IMMUNOLOGICAL FEATURES CHARACTERIZING OUR TWO COHORTS OF VACCINATED HD AND SLE. A, Frequency of DN1, DN2, PB/PC, act cTfh and act Tph used to create
the EF score and unpaired, Mann-Whitney U test shown for significance between HD and SLE cohorts. B, Age and race showing the distribution in HD and SLE based on vaccine responsiveness
(negative/low VNL, medium VM, or high VH). C, Distribution of females (F) and males (M) in our cohorts, based on vaccine responsiveness (negative/low VNL, medium VM, or high VH). D, Number
of subjects within each group based on age and vaccine responses clustered by age (18-50, >50 years old, yo). Each dot represents an individual sample collected at the indicated
time-points. Numbers of samples tested (n = ) are indicated in the figure. Boxplots represent min to max and show all points. E, Vaccine responsiveness based on sex (M/F) in our two cohorts.
F, AIM+ CD8 and G, AIM+ CD8 frequencies and percentage of non-responders identified for each vaccine group of VNL, VM, and VH. When indicated, LOD = limit of detection set to logarithmic
0.003 for T cells. LOS = limit of sensitivity, based on median values of baseline + 2 x SD. ****p < 0.0001. EXTENDED DATA FIG. 10 IMMUNOPHENOTYPE OF VACCINATED SLE CATEGORIZED BY
TREATMENT. A, Variance plot driving the PCA analyses. B, Simple cartoon showing lupus-associated drugs targeting B cells and table showing the main group of SLE divided by treatment as
analyzed in this study. C-H, Representative high-dimensional flow cytometry characterization of B cell in HD and SLE groups showing the comparison of C, CD19+ D, Naïve B cells, activated
Naïve (aN) B cell, Transitional B cells (Btr) and CD21lo Btr. E, CD27+ conventional memory. F, DN B cells and subsets; ratio of DN2:DN1 expressed as log2 value. G, IgD- ASC and CD20−CD38hi
PC. H, cTfh. SLE sub-group frequency of each population is compared to the HD group for statistical significance. When indicated in the graph, the gray line is a threshold for normal range
below (that is, CD19, DN1, cTfh) or above (that is, DN2, ASC, PC) the HD calculated average ranges. I, SELENA-SLEDAI score, comparison of sub-group of SLE by treatments. Statistical
comparisons performed with unpaired, two-sided Mann-Whitney U test. J, NT50 values for Delta and Omicron neutralization observed in HD and sub-groups of SLE. K, Relative frequency of spike
reactive B cell populations for all subjects from HD and SLE sub-groups based on CD27 and IgD expression. L, Symbol (one per column) with geometric mean values with 95% CI shown for spike
reactive CD8 and CD4 within all the SLE sub-groups and HD enrolled in the study. Boxplots represent mean and whiskers indicate range. Statistical comparison between HD and SLE sub-groups per
each vaccine dose performed with unpaired, Mann-Whitney U test. Not significant, ns p > 0.05; *p < 0.05; **p < 0.01; ***p < 0.001; ****p < 0.0001. SUPPLEMENTARY INFORMATION
SUPPLEMENTARY INFORMATION Supplementary Tables Supplementary Table 1. Cohort characteristics. Supplementary Table 2. Medications of vaccinated patients with SLE. REPORTING SUMMARY PEER
REVIEW FILE RIGHTS AND PERMISSIONS OPEN ACCESS This article is licensed under a Creative Commons Attribution-NonCommercial-NoDerivatives 4.0 International License, which permits any
non-commercial use, sharing, distribution and reproduction in any medium or format, as long as you give appropriate credit to the original author(s) and the source, provide a link to the
Creative Commons licence, and indicate if you modified the licensed material. You do not have permission under this licence to share adapted material derived from this article or parts of
it. The images or other third party material in this article are included in the article’s Creative Commons licence, unless indicated otherwise in a credit line to the material. If material
is not included in the article’s Creative Commons licence and your intended use is not permitted by statutory regulation or exceeds the permitted use, you will need to obtain permission
directly from the copyright holder. To view a copy of this licence, visit http://creativecommons.org/licenses/by-nc-nd/4.0/. Reprints and permissions ABOUT THIS ARTICLE CITE THIS ARTICLE
Faliti, C.E., Van, T.T.P., Anam, F.A. _et al._ Disease-associated B cells and immune endotypes shape adaptive immune responses to SARS-CoV-2 mRNA vaccination in human SLE. _Nat Immunol_ 26,
131–145 (2025). https://doi.org/10.1038/s41590-024-02010-9 Download citation * Received: 26 September 2023 * Accepted: 09 October 2024 * Published: 12 November 2024 * Issue Date: January
2025 * DOI: https://doi.org/10.1038/s41590-024-02010-9 SHARE THIS ARTICLE Anyone you share the following link with will be able to read this content: Get shareable link Sorry, a shareable
link is not currently available for this article. Copy to clipboard Provided by the Springer Nature SharedIt content-sharing initiative