ACC inhibitor alone or co-administered with a DGAT2 inhibitor in patients with non-alcoholic fatty liver disease: two parallel, placebo-controlled, randomized phase 2a trials
- Select a language for the TTS:
- UK English Female
- UK English Male
- US English Female
- US English Male
- Australian Female
- Australian Male
- Language selected: (auto detect) - EN
Play all audios:

Alterations in lipid metabolism might contribute to the pathogenesis of non-alcoholic fatty liver disease (NAFLD). However, no pharmacological agents are currently approved in the United
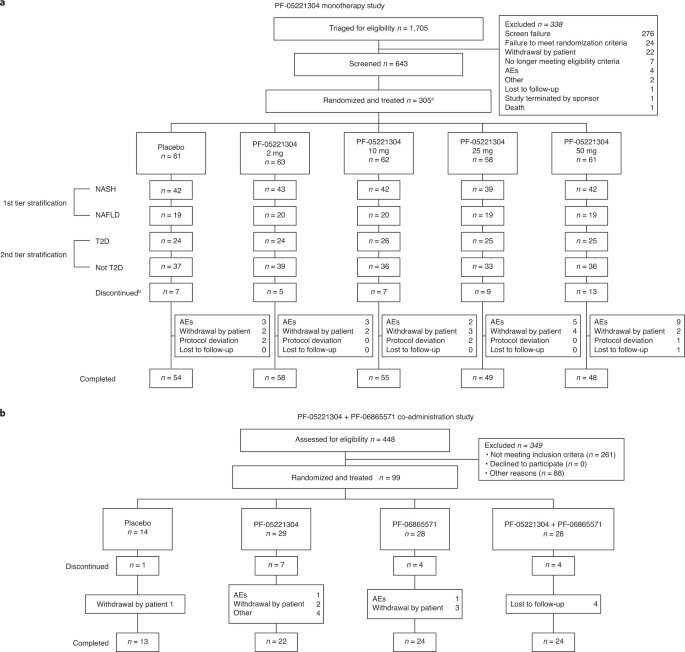
States or the European Union for the treatment of NAFLD. Two parallel phase 2a studies investigated the effects of liver-directed ACC1/2 inhibition in adults with NAFLD. The first study
(NCT03248882) examined the effects of monotherapy with a novel ACC1/2 inhibitor, PF-05221304 (2, 10, 25 and 50 mg once daily (QD)), versus placebo at 16 weeks of treatment; the second study
(NCT03776175) investigated the effects of PF-05221304 (15 mg twice daily (BID)) co-administered with a DGAT2 inhibitor, PF-06865571 (300 mg BID), versus placebo after 6 weeks of treatment.
The primary endpoint in both studies was percent change from baseline in liver fat assessed by magnetic resonance imaging–proton density fat fraction. Dose-dependent reductions in liver fat
reached 50–65% with PF-05221304 monotherapy doses ≥10 mg QD; least squares mean (LSM) 80% confidence interval (CI) was −7.2 (−13.9, 0.0), −17.1 (−22.7, −11.1), −49.9 (−53.3, −46.2), −55.9
(−59.0, −52.4) and −64.8 (−67.5, −62.0) with 16 weeks placebo and PF-05221304 2, 10, 25 and 50 mg QD, respectively. The overall incidence of adverse events (AEs) did not increase with
increasing PF-05221304 dose, except for a dose-dependent elevation in serum triglycerides (a known consequence of hepatic acetyl-coenzyme A carboxylase (ACC) inhibition) in 23/305 (8%)
patients, leading to withdrawal in 13/305 (4%), and a dose-dependent elevation in other serum lipids. Co-administration of PF-05221304 and PF-06865571 lowered liver fat compared to placebo
(placebo-adjusted LSM (90% CI) −44.6% (−54.8, −32.2)). Placebo-adjusted LSM (90% CI) reduction in liver fat was −44.5% (−55.0, −31.7) and −35.4% (−47.4, −20.7) after 6 weeks with PF-05221304
or PF-06865571 alone. AEs were reported for 10/28 (36%) patients after co-administered PF-05221304 and PF-06865571, with no discontinuations due to AEs, and the ACC inhibitor-mediated
effect on serum triglycerides was mitigated, suggesting that PF-05221304 and PF-06865571 co-administration has the potential to address some of the limitations of ACC inhibition alone.
Upon reasonable request, and subject to certain criteria, conditions and exceptions (see https://www.pfizer.com/science/clinical-trials/trial-data-and-results for more information), Pfizer
will provide access to individual de-identified participant data from Pfizer-sponsored global interventional clinical studies conducted for medicines, vaccines and medical devices (1) for
indications that have been approved in the United States and/or the European Union or (2) in programs that have been terminated (that is, development for all indications has been
discontinued). Pfizer will also consider requests for the protocol, data dictionary and statistical analysis plan. Data may be requested from Pfizer trials 24 months after study completion.
The de-identified participant data will be made available to researchers whose proposals meet the research criteria and other conditions, and for which an exception does not apply, via a
secure portal. To gain access, data requestors must enter into a data access agreement with Pfizer. Requests are handled on a case-by-case basis depending on the nature of the request and in
the order they are received. See https://www.pfizer.com/science/clinical-trials/trial-data-and-results for more information. Source data are provided with this paper.
These studies were sponsored by Pfizer Inc. The authors would like to thank the patients who offered their time, interest and participation as well as the staff across all sites who
recruited at least one patient in the clinical studies. The authors would also like to thank colleagues at Nordic Bioscience, M. Karsdal and D. J. Leeming, for their help with analysis of
the serum procollagens—Pro-C3, Pro-C4, Pro-C6 and Pro-C18—in NCT03248882; M. Birnbaum for helpful discussions; K. Kelly and D. Beebe for help with in vivo studies; J. Morin and D. Shanthappa
for assistance with shear-wave elastography measurements; J. Travers and A. Robertson for histology; S. Vargas for microscopic imaging of histological sections; and P. Garnick for clinical
study management. Medical writing support, under the direction of the authors, was provided by C. Cairney, CMC Connect, McCann Health Medical Communications, and was funded by Pfizer in
accordance with Good Publication Practice guidelines (Ann. Intern. Med. 163, 461–464 (2015)).
These authors contributed equally: Roberto A. Calle, Neeta B. Amin.
Internal Medicine Research Unit, Pfizer Inc, Cambridge, MA, USA
Roberto A. Calle, Neeta B. Amin, Trenton T. Ross, Collin Crowley, Anthony Rinaldi, Kou Kou, Greg Tesz, Robert Dullea, Kendra K. Bence, Albert M. Kim, Jeffrey A. Pfefferkorn & William P.
Esler
Santos Carvajal-Gonzalez, Arthur Bergman, Sudeepta Aggarwal, Jessica Mancuso, Veena Somayaji & Theresa A. Tuthill
Department of Infectious Diseases, Liver Diseases and Acquired Immune Deficiencies, Wrocław Medical University, Wrocław, Poland
Drug Safety Research and Development Global Pathology, Pfizer Worldwide Research and Development, Cambridge, MA, USA
R.A.C., N. Amin, S.C.-G., T.T.R., T.A.T., A.B., A.M.K., J.A.P. and W.P.E. were responsible for study conceptualization. R.A.C., T.T.R., C.C., A.R., A.B., V.S., S.C.-G., G.T., R.D., K.K.B.,
A.M.K. and W.P.E. were responsible for study design. R.A.C., N. Amin, S.C.-G., T.T.R., A.B., C.C., A.R., J.M., T.A.T., K.K. and M.B. were responsible for data analysis. R.A.C., N. Amin,
T.T.R., S.A., C.C., A.R., N. Aggarwal, M.I., T.A.T. and K.K. contributed to study conduct. All authors were responsible for data interpretation. N. Amin and T.A.T. provided resources and
were responsible for project administration. N. Amin, S.C.-G. and A.B. were responsible for data curation. N. Amin and W.P.E. were responsible for funding acquisition. N. Amin was
responsible for data visualization. R.A.C., N. Amin and T.T.R. were responsible for supervision. R.A.C., N. Amin, T.T.R., T.A.T. and W.P.E. wrote the original draft manuscripts. All authors
reviewed and edited the manuscript and approved the final draft.
R.A.C., N. Amin, S.C.-G., T.T.R., A.B., S.A., C.C., A.R., J.M., V.S.,T.A.T., K.K., M.B., G.T., R.D., K.K.B., A.M.K., J.A.P. and W.P.E. are employees of, and might hold stock options in,
Pfizer Inc. N. Aggarwal and M.I. have no conflicts of interest to declare.
Peer review information: Nature Medicine thanks Victor Volovici and the other, anonymous, reviewer(s) for their contribution to the peer review of this work. Jennifer Sargent was the primary
editor on this article and managed its editorial process and peer review in collaboration with the rest of the editorial team.
Publisher’s note Springer Nature remains neutral with regard to jurisdictional claims in published maps and institutional affiliations.
MMRM analysis of percent change from baseline over time in a, CAP in the overall population (Placebo n = 55, PF-05221304 2 mg, n = 56, 10 mg n = 62, 25 mg n = 52, 50 mg n = 53) and, b, VCTE
in the NASH subgroup (Placebo n = 42, PF-05221304 2 mg, n = 43, 10 mg n = 42, 25 mg n = 39, 50 mg n = 42), using FibroScan®, and in c, T-bili (Placebo n = 40, PF-05221304 2 mg, n = 42, 10 mg
n = 42, 25 mg n = 39, 50 mg n = 40), and d–g, procollagen isoforms in the NASH subgroup (Placebo n = 39, PF-05221304 2 mg, n = 40, 10 mg n = 42, 25 mg n = 35, 50 mg n = 38), and h, HbA1c in
patients with T2D (Placebo n = 23, PF-05221304 2 mg, n = 23, 10 mg n = 26, 25 mg n = 25, 50 mg n = 23). i, Percent change from baseline to last observation in liver fat (MRI–PDFF) versus
fasting serum triglyceridesa and j, percent change from baseline in fasting serum triglycerides versus baseline fasting serum triglyceridesa. MMRM analysis of percent change from baseline
over time to week 16 in the overall population in k, total cholesterol (Placebo n = 58, PF-05221304 2 mg, n = 62, 10 mg n = 62, 25 mg n = 58, 50 mg n = 59), and l, Apo E (Placebo n = 57,
PF-05221304 2 mg, n = 60, 10 mg n = 62, 25 mg n = 54, 50 mg n = 56). Data in panels a–h and k–l represent LSM (80% CI) from an MMRM model. aOne patient in the PF-05221304 10 mg treatment
group with a percent change from baseline to last observation in fasting serum triglycerides of 1727.9 was excluded from these graphs for visualization but was included in the analysis. This
patient had a percent change in liver fat of –38.9 and fasting serum triglycerides at baseline were 104 mg/dL (1.17 mmol/L). Apo, apolipoprotein; CAP, controlled attenuation parameter; CI,
confidence interval; HbA1c, glycated hemoglobin; LSM, least squares mean; MMRM, mixed-effects model for repeated measures; MRI–PDFF, magnetic resonance imaging-proton density fat fraction;
NAFLD, non-alcoholic fatty liver disease; NASH, non-alcoholic steatohepatitis; PF’1304, PF-05221304; Pro-C, procollagen type; T-bili, total bilirubin; T2D, type 2 diabetes; VCTE,
vibration-controlled transient elastography.
a, ACC1, b, FASN, c, SCD1, d, SREBP-1c, e, GPAT1, f, PCSK9. Data are mean (standard error) with n = 12 in each treatment group. Statistical significance based on ANOVA model adjusting for
unequal variances between groups. ACC1, acetyl-coenzyme A carboxylase 1; ANOVA, analysis of variance; FASN, fatty acid synthase; GPAT1, glycerol-3-phosphate acyltransferase 1; PCSK9,
proprotein convertase subtilisin/kexin type 9; SCD1, stearoyl coenzyme A desaturase 1; SREBP-1c, sterol regulatory element-binding protein 1c.
a, Relative change in hepatic triglycerides (n = 12 per group). Relative expression of b, ACTA2 (n = 12 per group), c, COL1A1 (n = 12 per group), d, IL10 (control diet n = 10, vehicle n =
11, PF-05221304 n = 11, PF-06865571 n = 11, and PF-05221304 and PF-06865571 co-administration n = 10), e, CCL2 (n = 12 per group), f, CCL11 (n = 12 per group), g, TNF (control diet n = 11,
vehicle n = 12, PF-05221304 n = 11, PF-06865571 n = 12, and PF-05221304 and PF-06865571 co-administration n = 11), h, CD4 (control diet n = 11, vehicle n = 12, PF-05221304 n = 11,
PF-06865571 n = 12, and PF-05221304 and PF-06865571 co-administration n = 11), i, IL1B (n = 12 per group), j, CD68 (control diet n = 11, vehicle n = 12, PF-05221304 n = 10, PF-06865571 n =
12, and PF-05221304 and PF-06865571 co-administration, n = 12), k, IL12A (n = 12 per group), l, IL12B (control diet n = 11, vehicle n = 10, PF-05221304 n = 11, PF-06865571 n = 11, and
PF-05221304 and PF-06865571 co-administration n = 12), m, IFNG (n = 12 per group, except control diet n = 11), n, CXCL1 (n = 12 per group), o, CXCL9 (control diet n = 12, vehicle n = 10,
PF-05221304 n = 11, PF-06865571 n = 12, and PF-05221304 and PF-06865571 co-administration n = 12), p, COL3A1 (control diet n = 11, vehicle n = 12, PF-05221304 n = 10, PF-06865571 n = 11, and
PF-05221304 and PF-06865571 co-administration n = 10). Data are mean (standard error). Statistical significance based on ANOVA model adjusting for unequal variances between groups. ACTA2,
alpha smooth muscle actin; ANOVA, analysis of variance; choline-deficient, amino acid-defined, high-fat diet; IFN, interferon; IL, interleukin; PF’1304, PF-05221304 monotherapy; PF’5571,
PF-06865571 monotherapy; PF’1304 + PF’5571, PF-05221304 and PF-06865571 co-administration; TNF, tumor necrosis factor.
Placebo n = 12, PF-05221304 n = 22, PF-06865571 n = 24, PF-05221304 and PF-06865571 n = 26. Data represent LSM (90% CI). Statistical significance versus placebo was pre-defined as a
two-sided p value of