The impact of rising sea temperatures on an Arctic top predator, the narwhal
- Select a language for the TTS:
- UK English Female
- UK English Male
- US English Female
- US English Male
- Australian Female
- Australian Male
- Language selected: (auto detect) - EN
Play all audios:

Arctic top predators are expected to be impacted by increasing temperatures associated with climate change, but the relationship between increasing sea temperatures and population dynamics
of Arctic cetaceans remains largely unexplored. Narwhals (Monodon monoceros) are considered to be among the most sensitive of Arctic endemic marine mammals to climate change due to their
limited prey selection, strict migratory patterns and high site fidelity. In the context of climate change, we assume that the population dynamics of narwhals are partly influenced by
changes in environmental conditions, with warm areas of increasing sea temperatures having lower abundance of narwhals. Using a unique large dataset of 144 satellite tracked narwhals, sea
surface temperature (SST) data spanning 25 years (1993–2018) and narwhal abundance estimates from 17 localities, we (1) assessed the thermal exposure of this species, (2) investigated the
SST trends at the summer foraging grounds, and (3) assessed the relationship between SST and abundance of narwhals. We showed a sharp SST increase in Northwest, Mideast and Southeast
Greenland, whereas no change could be detected in the Canadian Arctic Archipelago (CAA) and in the Greenland Sea. The rising sea temperatures were correlated with the smallest narwhal
abundance observed in the Mideast and Southeast Greenland ( 40,000 individuals). These results support the hypothesis that warming ocean waters will restrict the habitat range of the
narwhal, further suggesting that narwhals from Mideast and Southeast Greenland may be under pressure to abandon their traditional habitats due to ocean warming, and consequently either
migrate further North or locally go extinct.
Climate change is affecting almost all regions and ecosystems, with the Arctic demonstrating the greatest, irreversible consequences on marine life. Rapid sea-ice loss and increasing
temperatures1,2 are altering the distribution and abundance of low trophic-level organisms, generating cascading effects through the entire food chain from phytoplankton to mammalian
predators3. Arctic marine mammals have the potential to move over long distances to adapt to changing and erratic resource availability. However, their capacity to adjust long-term
adaptations, like site-fidelity and fixed migratory patterns, to climate-induced perturbations remains poorly known4,5.
Among Arctic cetaceans, the narwhal (Monodon monoceros) has a large geographic range extending from the Canadian Arctic Archipelago (CAA) to East Greenland, Svalbard and the western part of
the Russian Arctic6,7,8,9,10,11. Narwhals are known to exhibit a high degree of site-fidelity and to be closely associated with specific migratory corridors during spring and fall movements
between summer and winter grounds12. During winter, narwhals are mainly found in offshore areas over deep water and often in areas completely covered with pack-ice with only leads available
for breathing. In spring the narwhals move towards coastal areas. The inshore summer foraging grounds, where they congregate during the open water season, are considered the primary basis
for identifying separate population units of narwhals13.
Traditionally narwhals have been considered tightly associated with sea ice14, and while this may be the case for some populations most narwhal populations spend 2–3 summer and fall months
in ice-free areas but always in areas dominated by cold polar waters. Narwhals are generally considered to be among the most sensitive and vulnerable of Arctic endemic marine mammals to
climate changes15 due to their choice of habitat, limited prey selection, strict migratory patterns and high site fidelity. At the same time, narwhals are hunted in Greenland and Canada
where populations are monitored closely to detect changes that may by caused by the hunting pressure or the ongoing changes in the habitats. It is therefore important to understand the
current habitat selection of narwhals and the climate drivers that may potentially change their habitats.
A marked variability in abundance estimates across population units have been highlighted from aerial surveys conducted at the different summer grounds, with localities in the CAA showing a
greater abundance of narwhals (> 141,000 individuals) compared to West (~ 14,400) and East Greenland (~ 6400)16,17. The contrasting oceanographic conditions encountered at the different
summer grounds as well as the hunting pressure may explain the demographic variability for the species.
Cold and buoyant waters from the CAA enter northern Baffin Bay and are transported southward towards Davis Strait along the western part of Baffin Bay along the Canadian coast, while a warm
and salty subsurface current along the West Greenland coast transports dense Atlantic waters northward towards northern Baffin Bay18. In comparison, East Greenland is characterized by the
southward flowing East Greenland Current which transports cold water masses that are originally derived from the Arctic Ocean but are mixed with coastal runoffs from melting glaciers along
East Greenland19. In addition, warm and saline Atlantic waters flowing northward between Iceland and East Greenland (the Irminger Current) in the Denmark Strait occasionally reach the East
Greenland shelf break20. In a context of climate change, we therefore might assume that the population dynamics of narwhals are partly influenced by changes in environmental conditions, with
warm areas with increasing sea temperatures having lower abundance of narwhals. This is supported by the narrow temperature habitat usage observed in narwhals in East Greenland21.
Live-capture operations of narwhals were conducted in collaboration with Inuit hunters in Northeastern Canada, West and East Greenland. Set nets of 40 to 80 m length and 5 to 8 m deep were
deployed from shore to an anchor at suitable sites. Lookouts for whales were maintained from land-based promontories, from which the nets were kept under constant diurnal surveillance. As
soon as there were indications of a whale being entangled, the net was released from the anchor and the whale pulled to the surface and towards the shore where instrumentation took place.
Sex of the whales was determined based on presence (male) or absence (female) of a tusk. Various generations of Wildlife Computers (Redmond, Seattle, WA, USA) SLTDR, SPOT tags and FastLoc
transmitters were mounted on the tusk or for the majority of the whales on the keratinized dorsal ridge of the whales with 2–3 delrin nylon pins (8 mm diameter) secured with nylon washers
and bolts on each end22,23.
Location data were relayed through the Argos Data Collection and Location System and decoded using Argos Message Decoder (DAP Ver. 3.0, build 114, Wildlife Computers). The least-square
filtering algorithm was used for the Argos data until 2011, after which Kalman filtering was used. All statistical analyses were performed using R software version 3.6.224. The modelling
approach of Albertsen et al.25 implemented in the R package argosTrack26 was applied to the tracking data to improve the estimation of the whale’s actual tracks from Argos locations. Tracks
were estimated separately for each individual using a step-wise approach simplifying the estimation model if convergence issues were encountered, for instance for short tracks. Initially,
the estimation assumed a continuous time-correlated random walk movement model with t-distributed measurement error. Variance parameters were estimated for each Argos location class. If the
model did not converge properly, the ratio between variance parameters was fixed following the results of Albertsen et al.25. Subsequently, a multivariate normal distribution was used for
the measurement error with and without free variance parameters. Finally, if a model still had not converged, a random walk movement model was used with and without free measurement variance
parameters. In 2015, 2017 and 2018, Fastloc GPS transmitters were used and no estimation model was applied to their more precise GPS positions27,28. In order to assess temporal patterns,
seasons were discriminated as follows: autumn from October to December, winter from January to March, spring from April to June and summer from July to September. To assess the influence of
rising sea temperatures on narwhals we focused on the summer period which corresponds to peak of ocean temperatures in the Arctic.
We extracted environmental variables from model simulations to characterize the habitat experienced by the narwhals. The associated Sea Surface Temperature (SST) and Sea Ice Concentration
(SIC) data were first extracted daily from the products Global Ocean Physics Reanalysis Glorys S2V4 (PHYS 001-024) and the Global Ocean Physics Reanalysis Glorys12v1 (PHY-001-030) at a
resolution of 0.08° (from E.U. Copernicus Marine Service Information) at each whale location. In order to generate time-series of SST and SIC between 1993 and 2018, monthly grids of both
variables were also extracted from the products Global Ocean Physics Reanalysis Glorys12v1 (PHY-001-030) and Global Ocean and Physics Analysis Forecast (PHY-001-024) and averaged over the
extension of each of 17 summer foraging grounds with narwhal aggregations. The monotonic SST trends were then assessed for each summer ground using the trend package29.
Narwhals have strong site fidelity to their coastal summer grounds and narwhal aggregations are defined based on their summer distribution13,30. Abundance estimates that were obtained in
previous studies (from 11 of the 17 summer grounds, Table 1) where more than one abundance was available were used in the analysis. The methods used for obtaining the abundance estimates are
described in Heide-Jørgensen16 and Doniol-Valcroze17. The estimates were used to relate whales’ abundance and density (whales/km2) to SST, and assess the effect of temperature on the
abundance and densities of narwhals. SST data in August (month of the abundance surveys) were extracted at each summer ground for each sampled year. The relationships between abundance and
SST and whale density and SST were then investigated using a linear non-parametric Theil-Sen regression model from the mblm package31. To assess the relation between SST change over time and
the abundance of narwhals, the SST slope derived from each summer ground over the entire period (1993 to 2018) was related to the estimates of narwhal abundance and density separately.
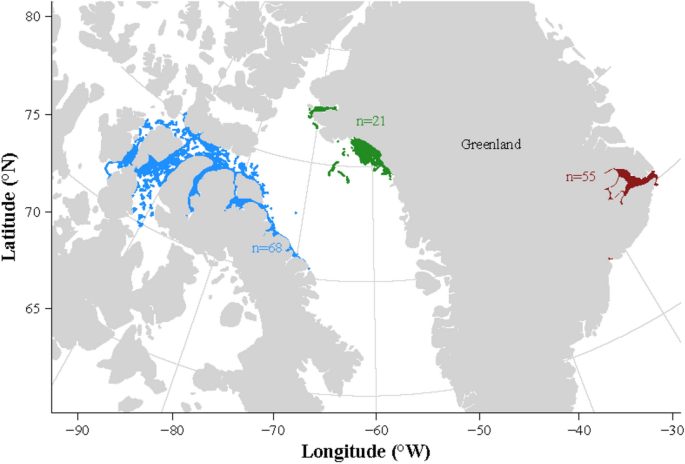
From 1993 to 2019, a total of 144 narwhals were satellite-tracked in summer in Canadian Arctic Archipelago (n = 68), West Greenland (n = 21) and East Greenland (n = 55)—see Fig. 1 and Table
SI1.
Summer distribution of narwhals’ tracks in the three tagging areas: the Canadian Arctic Archipelago, blue dots), West Greenland (green dots) and East Greenland (red dots). The number of
tracked narwhals is indicated in each colour.
In summer, narwhals tracked from populations in West Greenland and in the CAA dispersed widely across Baffin Bay, northern Baffin Island and within the fjords of the CAA. The narwhals that
were tracked from populations in East Greenland remained close to or just south of the Scoresby Sound summer ground (Mideast of Greenland).
The habitat encountered by the narwhals tracked from populations in the CAA, West and East Greenland differed in summer. Narwhals from West Greenland and CAA experienced significantly cooler
sea surface temperatures during summer (ranging between − 2 and 4 °C, Kruskal–Wallis test, p 99%, Fig. 2b, Kruskal–Wallis test, p