Torsional and lateral eigenmode oscillations for atomic resolution imaging of hopg in air under ambient conditions
- Select a language for the TTS:
- UK English Female
- UK English Male
- US English Female
- US English Male
- Australian Female
- Australian Male
- Language selected: (auto detect) - EN
Play all audios:

ABSTRACT Combined in-plane and out-of-plane multifrequency atomic force microscopy techniques have been demonstrated to be important tools to decipher spatial differences of sample surfaces
at the atomic scale. The analysis of physical properties perpendicular to the sample surface is routinely achieved from flexural cantilever oscillations, whereas the interpretation of
in-plane sample properties via force microscopy is still challenging. Besides the torsional oscillation, there is the additional option to exploit the lateral oscillation of the cantilever
for in-plane surface analysis. In this study, we used different multifrequency force microscopy approaches to attain better understanding of the interactions between a super-sharp tip and an
HOPG surface focusing on the discrimination between friction and shear forces. We found that the lateral eigenmode is suitable for the determination of the shear modulus whereas the
torsional eigenmode provides information on local friction forces between tip and sample. Based on the results, we propose that the full set of elastic constants of graphite can be
determined from combined in-plane and out-of-plane multifrequency atomic force microscopy if ultrasmall amplitudes and high force constants are used. SIMILAR CONTENT BEING VIEWED BY OTHERS
SIMULTANEOUS ACQUISITION OF CURRENT AND LATERAL FORCE SIGNALS DURING AFM FOR CHARACTERISING THE PIEZOELECTRIC AND TRIBOELECTRIC EFFECTS OF ZNO NANORODS Article Open access 03 February 2021
ATOMIC-FORCE-MICROSCOPY-BASED TIME-DOMAIN TWO-DIMENSIONAL INFRARED NANOSPECTROSCOPY Article 15 May 2024 OBSERVATION OF NANOSCALE OPTO-MECHANICAL MOLECULAR DAMPING AS THE ORIGIN OF
SPECTROSCOPIC CONTRAST IN PHOTO INDUCED FORCE MICROSCOPY Article Open access 10 November 2020 INTRODUCTION Understanding the in-plane nanomechanical behavior of graphitic surfaces at the
atomic scale under ambient conditions in air is of utmost importance to predict the long-term performance of graphene-based nanodevices such as van der Waals heterostructures1 or for DNA
sequencing2. Multifrequency atomic force microscopy (AFM)3 was shown to be an excellent tool for the quantification of forces at the nanoscale in out-of-plane as well as in in-plane
direction4,5,6. The out-of-plane force deconvolution and determination of elastic moduli from bimodal AFM spectroscopy data using the Sader method7 or the matrix method8 are well
established. In contrast, the determination of in-plane forces and shear moduli from spectroscopic data is still challenging9,10. One issue is the difficulty to excite the cantilever in the
in-plane direction. This problem can either be addressed by using qPlus sensors11,12,13 or by photothermal excitation14,15. The photothermal excitation technique is based on a
power-modulated laser focused at the base of the cantilever and a few micrometers off the cantilever length symmetry axis. This results in an in-plane oscillation if the excitation frequency
matches the resonance frequency of the desired eigenmode. Photothermal excitation facilitated atomic resolution imaging using the torsional-eigenmode oscillation in bimodal AFM16. A second
issue is the discrimination between torsional and lateral eigenmodes. In most publications the term “lateral” is used as synonym for both, the torsional and lateral eigenmode. This might
originate from the fact that in theory the lateral-eigenmode oscillation should not be observable using the beam detection methods as schematically explained by Ding et al_._17 and
illustrated in Fig. S1. However, they rationalized that the tip attached to the cantilever can induce coupling between lateral and torsional eigenmodes facilitating the detection of the
lateral resonance using a standard detection laser and segmented photodiodes. The authors demonstrated that both eigenmodes are useful for imaging and that the lateral oscillation might be
advantageous over the torsional one. The main issue in using the lateral eigenmode for imaging is the calibration of the inverse optical lever sensitivity (invOLS) to attain quantitative or
semi-quantitative data. There are a few approaches for the determination of the torsional invOLS18,19,20,21,22, whereas there is currently no procedure for the determination of the lateral
invOLS to the best of our knowledge. In this study, we compared the suitability of the torsional and the lateral eigenmodes for atomic resolution imaging of HOPG in air under ambient
conditions. The comparison is based on our recently published methodology named AMFlex2-FMTor1-FMFlex3 mode introduced in Ref.4 with a slightly modified setup (AMFlex2-FMLat1-FMFlex3). Both
setups exploit the second flexural eigenmode for the topographical feedback in amplitude modulation (AM) whereas the first torsional, first lateral and third flexural mode are
frequency-modulated (FM) and controlled by phase-locked-loop (PLL) electronics. Inspired by the work of colleagues in the field, we used higher flexural eigenmodes which were shown to be
beneficial for atomic resolution imaging due to the enhanced stiffness compared to the first flexural eigenmode23,24. Additionally, the combination of small free amplitudes and small
amplitude setpoints was used for imaging as it was shown by Santos et al_._25,26 and Lai et al_._27 that the method can lead to a very close proximity between tip and sample, being essential
for high resolution imaging. For some of the super-sharp tips we used, it was impossible to excite the second flexural and the first torsional eigenmode individually due to the close
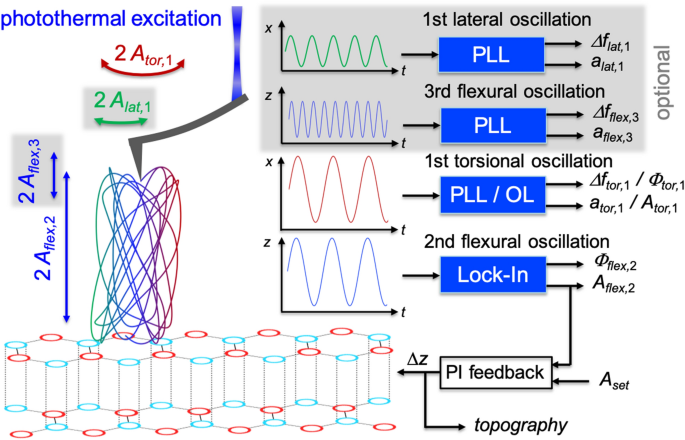
proximity of their resonance frequencies. Interestingly, the coupling of the two eigenmodes facilitated atomic resolution imaging. A scheme of possible setups as well as the resulting
movement of the tip are schematically shown in Fig. 1. If there is coupling between the second flexural and the first torsional eigenmode, the torsional oscillation cannot be controlled
individually (open loop (OL)). From the second flexural and the first torsional phase shifts, dissipation in out-of-plane and in-plane direction can be determined, respectively.
Unfortunately, the AMFlex2-OLTor1 mode is not suitable for the deconvolution of in-plane or out-of-plane forces. Consequently, we extended the AMFlex2-OLTor1 mode, by two phase-locked loops
(PLL) for frequency modulation (FM) of the first lateral and the third flexural eigenmode. The resulting AMFlex2-OLTor1-FMLat1-FMFlex3 mode such as schematically depicted in Fig. 1
facilitates quantification of in-plane and out-of-plane forces, reconstructed from lateral- and third-eigenmode flexural frequency-shift data. In this work, we analyzed the imaging
capability of coupled flexural/torsional oscillations as well as the suitability of the first lateral eigenmode for atomic resolution imaging and provide an approach for the calibration of
the lateral eigenmode optical lever sensitivity. In addition, we calculated in-plane forces from torsional and lateral frequency-shift data and analyzed the origin of the forces regarding
friction or shear. Analyzing the tip-trajectories, effective torsional and lateral amplitudes as well as the maximum indentation of the tip into the surface (with and without compression)
were estimated. The plausibility of the determined lateral forces was confirmed by calculating the lateral displacement using the literature value of the shear modulus of HOPG. RESULTS AND
DISCUSSION IMAGING CAPABILITY OF THE AMFLEX2-OLTOR1-FMLAT1 MODE FOR ATOMIC RESOLUTION From Fig. 2, we get an overview of the capability of different imaging channels for atomic resolution
imaging in air under ambient conditions depending on the _z_-sensor position. Increasing _z_-sensor position (from left to right) causes a reduction of the average tip-sample distance.
Figure 2a–e show schemes of the expected tip-trajectory corresponding to the AMFlex2-OLTor1-FMLat1 mode with a lateral-eigenmode amplitude setpoint of _A__lat,_1 = 863 pm. The shown
tip-trajectories were calculated by plotting the out-of-plane deflection _z_(_t_) _vs._ the in-plane deflection _x_(_t_) of the cantilever using linear combinations of cosine functions such
as shown by Benaglia et al_._28 for the _z_-component and assuming that _Φ__tor,_1 = 90° (see Eqs. (S1, S2) and Fig. S2 of the Supplementary Information for details). The lateral-eigenmode
invOLS was calibrated by imaging a wrinkle of a graphene layer on an HOPG sample with different lateral amplitude setpoints while oscillating perpendicular to the wrinkle and comparing the
images with the results of a Savitzky-Golay-filtered reference image. A detailed description of the technique can be found in Section 4 (Calibration of lateral-oscillation-eigenmode
sensitivity) of the Supplementary Information. From Fig. 2a–e the second flexural-eigenmode-amplitude setpoint is reduced from 700 to 454 pm, causing a reduction of the torsional amplitude
due to the coupling of both modes (Fig. 2, second row). The corresponding approximate _z_-sensor position can be taken from the third row of Fig. 2. From spectroscopic experiments (local
amplitude distance curves recording all available observables), we can visualize the dependence of the second flexural amplitude (Fig. 2f), the first torsional amplitude (Fig. 2l) and the
first lateral frequency shift (Fig. 2r) on the _z_-sensor position. The crossed circles mark the positions where the AFM images of Fig. 2 where taken. The height images are shown in Fig.
2g–k, the “error images” of the first torsional amplitude in Fig. 2m–q and the first lateral frequency-shift images in Fig. 2s–w. “Error images” of the first torsional amplitude here means
the deviation of the actual torsional amplitude relative to the torsional-amplitude setpoint corresponding to the second flexural-amplitude setpoint due to the coupling of both eigenmodes.
Comparing the amplitude _vs. z_-position curves in Fig. 2f,l, it becomes evident that although the second flexural and the first torsional oscillations are coupled, they show different
dependencies on the tip-sample distance. These differences are consistent with results from uncoupled flexural–torsional AFM studies in open-loop configuration16. The lateral frequency shift
_vs. z_-sensor position curve in Fig. 2r shows an increasing repulsive interaction with decreasing tip-sample distance. Atomic resolution imaging was feasible in all three channels as e.g.
visible in Fig. 2k,q,w at a _z_-sensor position of approximately 3.7 nm. Interestingly, the lateral frequency-shift images show atomically resolved structures at setpoint ratios up to 93% of
the second flexural-eigenmode amplitude as observable in Fig. 2s, which corresponds to a _z_-sensor value of approximately 2.2 nm. Compared to imaging with “uncoupled” cantilevers, where
atomic resolution imaging was impossible to achieve using setpoint ratios larger than 15%, it is reasonable to believe that performing measurements with “coupled” cantilevers implies more
gentle conditions, preserving the integrity of both, tip and sample. Note, that the torsional amplitude ratio was already at 63% which fits to our observation that the stiffness of the
second flexural eigenmode was higher compared to the first torsional eigenmode stiffness for the type of cantilevers used in this study (see “Materials and methods” for details). At this
position, however, neither in the height image (Fig. 2g) nor in the torsional-amplitude error image (Fig. 2m) atomic contrast could be resolved. Lowering the second
flexural-eigenmode-amplitude setpoint, atomic contrast becomes more and more apparent in the height images (Fig. 2m–q). The growing corrugation amplitude (measured vertical distance between
atomic and hollow side) is assumed to originate from an increase in the mean cantilever deflection16,29,30. Strikingly, the height image at a _z_-sensor position of 3.7 nm (Fig. 2k) shows a
step which matches the height of individual graphene layers. This step is neither observable in the Δ_A__tor_,1 image (Fig. 2q) nor in the Δ_f__lat_,1 image at the same _z_-sensor position.
Consequently, the topographic feedback seems to function extremely precise. Another interesting observation is, that the atomic structure at both, the lower and the upper plateau of the
graphene step, exhibit the same arrangement of carbon atoms. This leads us to the conclusion that we imaged a monoatomic step edge covered by a small number of graphene layers which is in
line with results shown by Abooalizadeh et al_._31. From this observation the question arises why we were not able to resolve the step at smaller _z_-sensor positions. To answer the
question, we exemplarily drew two cross sectional profiles through the height images shown in Fig. 2k,j (see Fig. S3 in the Supplementary Information). We assume that the visibility of the
step edge depends on whether the average tip-sample force (represented by the mean deflection, averaged over several oscillation cycles) is predominantly attractive or repulsive. On the
right side of Fig. S3, we schematically sketched the alleged interaction between tip and sample on a covered step edge. In the predominantly attractive regime, we assume that several
graphene layers cover the step such as depicted in the top right part of Fig. S3. As discussed in our recent work and by others4,32, it is reasonable to believe that the topmost carbon
layers are lifted by the attractive tip-sample interactions. Consequently, the tip will not sense the step edge. If imaging takes place in the predominantly repulsive regime, we assume that
the graphene cover layers are tightly stretched over the step edge as sketched in the bottom right of Fig. S3. From the imaging results shown in Fig. 2 we can conclude that the coupled
motion of the cantilever (AMFlex2-OLTor1) seems to promote atomic resolution at higher setpoint ratios (_A__flex,_2/_A_0_(flex,_2_)_) compared to uncoupled ones. This can, on the one hand,
be attributed to the enhanced dynamic stiffness of the coupled flexural/torsional oscillation of the cantilever and, on the other hand, to the oval shape of the tip trajectory. This might
lead to a reduced influence of the interactions far away from the center of the oscillation, because the tip will have the closest distance to the sample and therefore the highest
interaction at the currently measured local position. Nevertheless, the largest drawback of imaging with coupled cantilever modes is that the relation between the flexural and the torsional
amplitudes cannot be set individually. Additionally, it needs to be considered that the combined in-plane oscillation of torsional and lateral components needs to be analyzed in detail in
order to get a better understanding regarding the interaction with the sample. An idea for future studies would be tailoring cantilevers e.g. by a controlled introduction of holes at
different positions of the cantilever such as shown by Eslami et al_._33, in order to analyze the influence of different resonance-frequency ratios. COMPARISON OF TORSIONAL AND LATERAL
FREQUENCY-SHIFT IMAGES AS A FUNCTION OF THE AMPLITUDE SETPOINTS In order to gain deeper insights into the different oscillation behaviors of the torsional and the lateral eigenmodes, we
analyzed several 5 × 5 nm2 frequency-shift images taken in the AMFlex2-FMLat1-FMFlex3 mode and the AMFlex2-FMTor1-FMFlex3 mode at different lateral- and torsional-eigenmode setpoints. The
results are shown in Fig. 3. In Fig. 3a,e and Fig. 3d,h lateral and torsional frequency-shift images (2.5 × 2.5 nm2 zoom-in) taken at _A__lat,_1 = 518 pm (a), _A__lat,_1 = 3451 pm (e) and
_A__tor,_1 = 158 pm (d), _A__tor,_1 = 628 pm (h) are shown exemplarily. The corresponding histograms of the lateral and the torsional frequency-shift images can be seen in Fig. 3b,c,
respectively. The open circles in Fig. 3f,g show the lateral and torsional frequency shifts at maximum counts and the dashed lines represent the full width at half maximum (FWHM) as a
function of the lateral- and torsional-amplitude setpoints, respectively. If we compare the frequency-shift images taken in the AMFlex2-FMLat1-FMFlex3 mode in Fig. 3a,e with the images taken
in the AMFlex2-FMTor1-FMFlex3 mode in Fig. 3d,h we observe that atomic contrast was achieved in all images but the range of the frequency-shift values strongly differs. While the lateral
and torsional frequency-shift images taken at the higher-amplitude setpoints (_A__lat,_1 = 3451 pm and _A__tor,_1 = 628 pm) shown in Fig. 3e,h show similar frequency-shift ranges, the
frequency-shift images at smaller-amplitude setpoints (_A__lat,_1 = 518 pm and _A__tor,_1 = 158 pm) in Fig. 3a,e clearly differ regarding their frequency-shift ranges and the distribution of
the values. This becomes even more evident by looking at the histograms corresponding to frequency-shift images taken at five different lateral- (Fig. 3b) and torsional-amplitude (Fig. 3c)
setpoints. In general, the full width at half maximum (FWHM) of the peaks increases with decreasing amplitude setpoints (lateral/torsional). The histograms of the lateral frequency-shift
images remain symmetric around a center value of approximately 120 Hz, whereas the histograms of the torsional frequency-shift images become asymmetric for torsional-amplitude setpoints
smaller than 314 pm. As a result, the maxima of the histograms are shifted to more repulsive values. Moreover, the third eigenmode flexural frequency shift is only slightly influenced by the
lateral- or torsional-eigenmode amplitude which corroborates the assumption of the independency of the in-plane (lateral/torsional) and the out-of-plane (flexural) eigenmodes (Fig. 3f,g
(top graphs)). Interestingly, we observe that although the torsional- and lateral-amplitude setpoints are in most cases substantially larger than the interatomic spacing of the carbon atoms,
we can still obtain atomic contrast in the frequency-shift images. To further investigate this phenomenon, we calculated the tip-trajectory resulting from the combined lateral-flexural
(Fig. 4a,b) or torsional-flexural (Fig. 4c,d) oscillations of the cantilever according to equations (S1, S2) for two different lateral and torsional amplitudes, respectively. It needs to be
mentioned that in Fig. 4 only an extract of the full oscillation trajectory is shown. While imaging one position, almost every point in the area spanned by _A__flex_,2 + _A__flex_,3 and
_A__tor,_1 or _A__lat,_1, respectively, is reached such as plotted in the Supplementary Information (Fig. S6). From Fig. 4 it becomes obvious that the interaction between tip and sample
strongly depends on the curvature of the tip. For the situations shown in Fig. 4a,b,d we interpret, that the minimum distance from the lower turning point of the tip-trajectory to the
intersection of the tip-trajectory and the horizontal line (purple dotted) defined by the interatomic spacing between two atoms (here 246 pm, due to the tip oscillating perpendicular to the
carbon bonds) determines the indent (without distortion of the carbon atoms) of the tip into the carbon ring (vertical purple line). This indent without distortion of carbon atoms
corresponds to the corrugation amplitude (_A__C-H_). Thus, we defined the effective in-plane amplitudes as half of the horizontal distance between two carbon atoms (here: _A__lat,_1_ (eff)_
= _A__tor,_1 _(eff)_ = 123 pm because the tip oscillates perpendicular to the carbon bonds) for the situations shown in Fig. 4a,b,d. From the situation shown in Fig. 4c we found that if the
tip-trajectory shows a higher curvature, the effective amplitude is no longer equivalent to half of the distance between two carbon bonds. This is a result of the maximum possible
corrugation amplitude which was reported by Kawai et al_._ to equal 85 pm in the repulsive regime32. This value was additionally verified by performing dynamic spectroscopy experiments such
as shown in Fig. S5 of the Supplementary Information. Consequently, the effective amplitude is still determined by the intersection between the tip-trajectory and the horizontal line (purple
dotted) defined by the interatomic spacing between two atoms, but it becomes smaller than 123 pm due to the limited corrugation amplitude. If we calculate the effective torsional amplitude
from the tip-trajectory in Fig. 4c, assuming a corrugation amplitude of 85 pm, it would be approximately 83 pm, which is in line with the 79 pm determined in our recent work4. We can
conclude that imaging the atomic structure of HOPG in the frequency-shift channel is also possible with in-plane oscillations larger than half of the interatomic spacing, but the resolution
in the height images is strongly reduced due to the small corrugation amplitudes. Additionally, it needs to be considered that the frequency-shift images reflect the tip-sample interaction
averaged over a few carbon hexagons. This needs to be kept in mind if forces are determined from the frequency-shift images. Nevertheless, due to the formation of plateaus in the torsional
and lateral frequency shift values for larger in-plane oscillation amplitudes (see Fig. 3f,g (bottom graph)), we propose that conclusions about different interaction mechanisms, _i.e._
friction or shear, as a function of the different in-plane oscillation amplitudes can be drawn. We point out that the most obvious way of determining the corrugation amplitude would be the
analysis of the topography images. Unfortunately, the topography images are strongly influenced by the mean cantilever deflection, so that the corrugation amplitude is not directly
accessible4. CALCULATION OF LATERAL AND TORSIONAL FORCES From Fig. 3, we additionally observed that the full width at half maximum becomes much broader for the smaller lateral-amplitude
setpoints compared to the torsional-amplitude setpoints. In order to identify the origin of the differences between torsional and lateral frequency-shift behavior, we calculated the forces
from the images taken at _A__lat,_1 = 518 pm and _A__tor,_1 = 158 pm (_A__flex,_2 = 110 pm and _A__flex,_3 = 145 pm), respectively. The results are presented in Fig. 5. Schemes of the
interaction between tip and sample are shown in Fig. 5a,d. The lateral and torsional frequency-shift images are shown in Fig. 5b,e. In Fig. 5c,f forces calculated from the frequency-shift
images in Fig. 5b,e by using the Fourier method4,35 are shown. Obviously, both, the torsional and the lateral force image in Fig. 5c,f reproduce the hexagonal structure of graphene. It needs
to be mentioned that this is only the case if the forces are calculated by using the effective torsional or lateral amplitude. Interestingly, forces determined from the lateral
frequency-shift image in Fig. 5b are around 50 times larger compared to the forces (Fig. 5f) calculated from the torsional frequency-shift images in Fig. 5e. We propose that this large
difference in forces originates partially from the difference in force constants but also/mainly from different types of interaction mechanisms between tip and sample, i.e. friction and
shear. While Weymouth et al_._11,36 observed “non-contact friction” during imaging of an H-terminated Si(100) surface in dynamic lateral force microscopy using a qPlus sensor13, we assume
that the lateral frequency shift determined on HOPG at 518 pm lateral amplitude mainly originates from a local shear due to relatively weak van-der-Waals interactions between the carbon
layers. We assume this to happen for two reasons: First, the angle under which the tip touches the surface at the respective local position is less steep for the shown lateral oscillation
compared to the torsional one. Second, the lateral stiffness of the cantilever is higher compared to the torsional stiffness which might lead to shear for a certain range of lateral
oscillation amplitudes whereas torsional amplitudes of the same magnitude result in frictional interaction between tip and sample. In order to verify our assumption about shearing
interaction for the constellation shown in Fig. 5a–c we calculated the lateral displacement _Δx_ of the topmost carbon layer relative to the second one if we assume a shear modulus of 4.18
GPa in x-z-direction37. In a simple approximation, the shear modulus _G__xz_ can be calculated by $${G}_{xz}=\frac{{F}_{lat}\cdot d}{\Delta x\cdot {A}_{c}},$$ (1) where _d_ is the distance
between two carbon layers (334 pm) and _A__c_ is the contact area between tip and sample which can be calculated according to Hertz from the tip radius _R_ and the indentation _δ_38
$${A}_{c}=\pi R\delta .$$ (2) In order to determine the indentation _δ_ which is caused by the tip oscillating over a carbon atom, we used Hertz contact mechanics model38
$$F=\frac{4}{3}{E}^{*}\sqrt{R{\delta }^{3}},$$ (3) where _E_* is the effective Young’s modulus which can be considered here as equal to the Young’s modulus _E_zz of graphite due to the high
stiffness of the diamond-like-carbon tip. The maximum value of _F__flex,_3 was calculated in our resent work to be approximately 520 pN for the AMFlex2-FMTor1-FMFlex3 mode4. Due to the
similarity of the third-eigenmode flexural frequency-shift values we chose this value as representative for all the other experiments. By rearranging Eq. (3) and inserting _E_zz = 36.5 GPa
as reported by Blakslee et al_._39 we determined an indentation of approximately 50 pm. Using _δ_ = 50 pm and rearranging Eq. (1), we calculated a local displacement of approximately _Δx_ =
157 pm between the first and the second graphene layer. This implies a shift by the length of approximately one carbon–carbon bond (142 pm) which seems to be reasonable in distance. We
corroborated our findings by performing additional friction force microscopy images, however, using a comparably large vertical deflection setpoint (43 nm ≙ 1100 nN) in order to ensure
permanent contact between tip and sample. By means of the analysis of cross sections drawn through lateral deflection trace and retrace images, the actual lateral tip-position was
calculated. The results are shown in Fig. S5 of the Supplementary Information. As expected, the typical stick–slip movement of the tip imaging an HOPG surface was observed40, however, the
stiction was stretched out over a region of approximately 150 pm, which can be interpreted as a temporary shift of the topmost carbon layer relative to the second one. For the tip-trajectory
of the torsional oscillation shown in Fig. 5d, we observe a very similar oscillatory behavior, however, much more compact in the in-plane direction, resulting from the smaller torsional
amplitude. As a consequence, the angle at which the tip approaches and finally touches the surface is much steeper and therefore a negligible shifting of the first carbon layer relative to
the second is assumed to take place. We suppose that the torsional forces involved in this mechanism can be interpreted as strongly localized frictional forces which is on the one hand in
accordance with the magnitude of frictional forces on graphene determined by Lee et al_._41. On the other hand, the interpretation is in compliance with the observation of direction
dependent torsional forces observed in our recent work4. Additionally, it needs to be highlighted, that the flexural/torsional oscillation of the cantilever simulated here is symmetric in
out-of-plane direction but not in in-plane direction such as schematically shown in Fig. S6 of the Supplementary Information. This can explain the shift between topography and
frequency-shift images such as shown in our recent work4. For the flexural/lateral oscillation the tip-trajectory is overall symmetric in both, in-plane and out-of-plane direction (see Fig.
S6). Here, no shift between the height and the frequency-shift images could be observed. However, it needs to be mentioned that the resolution in the height images was strongly reduced if
imaging was accomplished with the lateral instead of the torsional eigenmode. The effect can be attributed to the shear interaction between tip and sample. If the lateral or the torsional
amplitudes become larger in size, we observe averaged friction along the surface which might explain the formation of the plateaus in the frequency shifts in Fig. 3f,g (bottom graph). Here,
we also observed that the flexural frequency-shift values and therefore the flexural forces are only slightly influenced by the in-plane oscillation amplitudes. In theory, it should
additionally be possible to determine the in-plane Young’s moduli _E__xx_ = _E__yy_ and _E__xy_ by using higher torsional or lateral eigenmodes of the cantilever. Unfortunately, it is
nontrivial to control these higher eigenmodes and determine their invOLS as well as the corresponding force constants. Nevertheless, this approach could be considered as an alternative
method for the determination of the Young’s modulus of graphene instead of the frequently used techniques where graphene is spanned over membranes or holes and _E__xx_ is calculated from
nanoindentation experiments42,43. Therefore, we propose that the simultaneous determination of strongly localized in-plane and out-of-plane sample properties such as shear moduli and Young’s
moduli using multifrequency AFM is feasible if very small amplitudes and adequate force constants are used for the analysis. The main advantage of determining elastic properties at the
atomic scale is the possibility to locally assess the influence of atomic defects in the material, which were shown to strongly influence the mechanical stability of graphene samples on a
larger scale43. Serving the large scientific interest to analyze the origin of friction anisotropy on graphene and graphite samples44,45,46,47, we are convinced that our presented
multifrequency AFM method can substantially contribute to gain deeper insights into in-plane sample properties by comparing the mechanical properties on the atomic scale with that on the
nano-/micrometer scale. The ability to compare material properties at different length scales in air under ambient conditions is of particular interest for the analysis of adsorbate
formation46,47 or ripples44,45 on a graphitic surface which strongly influences the performance of graphene-based nanodevices. Additionally, the availability of torsional and lateral
eigenmodes extends the spectrum of oscillation modes, facilitating the simultaneous acquisition of different in-plane sample properties, using one and the same cantilever. CONCLUSION In
summary, we demonstrated that performing multifrequency AFM with in-plane and out-of-plane components of the tip-motion has additional potential for atomic resolution imaging of HOPG
surfaces. The coupling of the second flexural and the first torsional eigenmode facilitates imaging with atomic contrast at higher amplitude-setpoint ratios, although the quantitative
interpretation of the results is challenging if the torsional and the lateral oscillation amplitude are simultaneously excited. In order to estimate the inverse optical lever sensitivity of
the lateral cantilever eigenmode, a calibration procedure was proposed which is based on imaging a graphene wrinkle with different lateral amplitude setpoints while oscillating perpendicular
to the wrinkle and comparing the images with the results of a Savitzky-Golay-filtered reference image. We compared the results from imaging in the AMFlex2-FMLat1-FMFlex3 and the
AMFlex2-FMTor1-FMFlex3 mode. Analyzing the tip-trajectories and the in-plane forces resulting from both modes with the respective amplitudes, we proposed that imaging with small lateral
amplitudes can result in localized shear of the first graphite layer with respect to the second one with a relative displacement of 157 pm. The applied out-of-plane forces caused an
indentation of approximately 50 pm of the top graphene layer. Both values are in a reasonable range to propose that the AMFlex2-FMLat1-FMFlex3 method can be used for the simultaneous
determination of _E__xz_ = _E__yz_ and _G__xz_ = _G__yz_. Imaging with the AMFlex2-FMTor1-FMFlex3 in contrast, promotes rather frictional forces which we mainly attributed to the smaller
force constant and the curved tip-trajectory compared to the lateral eigenmode. Based on our findings, we suggest that the use of higher in-plane cantilever eigenmodes or generally stiffer
cantilevers can provide a strategy to determine the shear moduli on HOPG and graphene also with torsional eigenmodes. The method carries great potential for future assessment of graphene in
nanodevices where local differences in mechanical properties e.g. induced by defects or adsorbates, play a major role. To this end, the in-plane oscillation amplitudes need to be in the
range of the interatomic spacings, which is still challenging to achieve while imaging in air under ambient conditions due to the small signal-to-noise ratio. With the presented method we
aim to promote the analysis of friction anisotropy observed on graphene by the comparison of atomic and nano-/micrometer resolution images at different relative orientations between the
hexagonal carbon lattice and the in-plane cantilever oscillation using torsional and/or lateral eigenmodes. This can help to investigate the origin of fundamental friction mechanisms
underlaying graphene-based systems. Additionally, we expect that the presented method might not only be limited to the analysis of stiff samples but also can be applied for a broad range of
materials, including soft matter, facilitating a complete in- and out-of-plane sample surface characterization. MATERIALS AND METHODS SAMPLE The HOPG sample (grade 2, mosaic spread angle:
0.8 ± 0.2°) was purchased from SPI Supplies (Structure Probe, Inc., West Chester, PA, USA). Cleaving was performed prior to the AFM experiments with adhesive tape in air under ambient
conditions to expose a fresh clean surface. CANTILEVERS Super-sharp cantilevers of the type HiResC15/Cr-Au purchased from Mikromasch (Innovative Solutions Bulgaria Ltd., Sofia, Bulgaria)
were used. Although of the same type, the cantilevers showed slightly varying resonance frequencies resulting in “coupled” and “uncoupled” eigenmodes. For the AFM images shown in Fig. 2 we
used a cantilever with “coupled” second flexural and first torsional eigenmodes as it depicted a close proximity of both resonance frequencies. For the AFM images shown in Figs. 3 and 5
cantilevers with “uncoupled” eigenmodes were used. The resonance frequencies, quality factors and force constants of the used cantilevers are listed in Table 1. Details for the determination
of the force constants are given in Section 7 of the Supplementary Information. The tip radius of the cantilevers was _R_ = 1 nm according to the manufacturer's data sheet. In Section
8 of the Supplementary Information we list the ratios between the flexural, torsional and lateral resonance frequencies determined for several cantilevers of the type HiResC15/Cr-Au for
further considerations. ENVIRONMENTAL CONDITIONS The AFM-lab was equipped with a controlled ventilation system, which provided stable environmental conditions also inside the AFM chamber.
The temperature and the relative humidity in the AFM chamber were tracked by sensors and remained stable during imaging (relative humidity: 22 ± 2%, temperature: 26 ± 2 °C). AFM SETUP A
Cypher S atomic force microscope (Asylum Research, Oxford Instruments, Santa Barbara, CA, USA) equipped with a built-in blueDrive photothermal excitation setup for dynamic AFM modes was used
for all experiments. The blueDrive laser was focused at the fixed end of the cantilever and the lateral position was optimized by finding the spot that led to the maximum possible in-plane
amplitude. A scheme for the approximate positioning of the laser spots on the cantilever is shown in Fig. S1e of the Supplementary Information. The respective frequency shifts (depending on
the method used) were tracked with additional phase-locked loops (HF2PLL, Zurich Instruments, Zurich, Switzerland). The drive amplitudes of the frequency-modulated eigenmodes were adjusted
in order to maintain constant amplitudes by two PID controllers implemented in the same instrument. DATA PROCESSING The topography and the torsional-amplitude error images were first-order
flattened to remove any tilt from the images using the Igor Pro v6.36 software (WaveMetrics Inc., Lake Oswego, OR, USA). In order to remove noise from the small-scale images a 3 × 2 Gauss
filter was applied to all AFM images except for the ones used for the determination of the lateral invOLS (Fig. S4). For the calculation of the torsional and the lateral force images in Fig.
5 we wrote a Matlab code (MATLAB R2018a, MathWorks Inc., Natick, MA, USA) for the implementation of the Fourier method based on the script provided by Seeholzer et al_._4,35. The calculated
force images were smoothed with a Savitzky–Golay filter over nine points with a first-order polynomial. DATA AVAILABILITY All data will be made available from the authors upon reasonable
request. REFERENCES * Wang, J., Zhang, D. & Zhou, B. Achieving an Ohmic contact in graphene-based van der Waals heterostructures by intrinsic defects and the inner polarized electric
field of Janus AlGaSSe. _New J. Chem._ 45, 21178–21187. https://doi.org/10.1039/D1NJ03861C (2021). Article CAS Google Scholar * Heerema, S. J. & Dekker, C. Graphene nanodevices for
DNA sequencing. _Nat. Nanotechnol._ 11, 127–136. https://doi.org/10.1038/nnano.2015.307 (2016). Article ADS CAS PubMed Google Scholar * Garcia, R. & Herruzo, E. T. The emergence of
multifrequency force microscopy. _Nat. Nanotechnol._ 7, 217–226. https://doi.org/10.1038/nnano.2012.38 (2012). Article ADS CAS PubMed Google Scholar * Eichhorn, A. L. & Dietz, C.
Simultaneous deconvolution of in-plane and out-of-plane forces of HOPG at the atomic scale under ambient conditions by multifrequency atomic force microscopy. _Adv. Mater. Interfaces_ 8,
2101288. https://doi.org/10.1002/admi.202101288 (2021). Article CAS Google Scholar * Uhlig, M. R., Martin-Jimenez, D. & Garcia, R. Atomic-scale mapping of hydrophobic layers on
graphene and few-layer MoS2 and WSe2 in water. _Nat. Commun._ 10, 2606. https://doi.org/10.1038/s41467-019-10740-w (2019). Article ADS CAS PubMed PubMed Central Google Scholar *
Baykara, M. Z. _et al._ Exploring atomic-scale lateral forces in the attractive regime: A case study on graphite (0001). _Nanotechnology_ 23, 405703.
https://doi.org/10.1088/0957-4484/23/40/405703 (2012). Article ADS CAS PubMed Google Scholar * Sader, J. E. & Jarvis, S. P. Accurate formulas for interaction force and energy in
frequency modulation force spectroscopy. _Appl. Phys. Lett._ 84, 1801–1803. https://doi.org/10.1063/1.1667267 (2004). Article ADS CAS Google Scholar * Giessibl, F. J. A direct method to
calculate tip–sample forces from frequency shifts in frequency-modulation atomic force microscopy. _Appl. Phys. Lett._ 78, 123–125. https://doi.org/10.1063/1.1335546 (2000). Article ADS
Google Scholar * Kawai, S. _et al._ Ultrasensitive detection of lateral atomic-scale interactions on graphite (0001) via bimodal dynamic force measurements. _Phys. Rev. B_ 81, 085420.
https://doi.org/10.1103/PhysRevB.81.085420 (2010). Article ADS CAS Google Scholar * Dietz, C. Sensing in-plane nanomechanical surface and sub-surface properties of polymers: Local shear
stress as function of the indentation depth. _Nanoscale_ 10, 460–468. https://doi.org/10.1039/c7nr07147g (2018). Article CAS Google Scholar * Weymouth, A. J. _et al._ Atomic structure
affects the directional dependence of friction. _Phys. Rev. Lett._ 111, 126103. https://doi.org/10.1103/PhysRevLett.111.126103 (2013). Article ADS CAS PubMed Google Scholar *
Martin-Jimenez, D. _et al._ Chemical bond imaging using torsional and flexural higher eigenmodes of qPlus sensors. _Nanoscale_ 14, 5329–5339. https://doi.org/10.1039/D2NR01062C (2022).
Article CAS PubMed Google Scholar * Giessibl, F. J. The qPlus sensor, a powerful core for the atomic force microscope. _Rev. Sci. Instrum._ 90, 011101. https://doi.org/10.1063/1.5052264
(2019). Article ADS CAS PubMed Google Scholar * Pini, V., Tiribilli, B., Gambi, C. M. C. & Vassalli, M. Dynamical characterization of vibrating AFM cantilevers forced by
photothermal excitation. _Phys. Rev. B_ 81, 054302. https://doi.org/10.1103/PhysRevB.81.054302 (2010). Article ADS CAS Google Scholar * Kiracofe, D., Kobayashi, K., Labuda, A., Raman, A.
& Yamada, H. High efficiency laser photothermal excitation of microcantilever vibrations in air and liquids. _Rev. Sci. Instrum._ 82, 013702. https://doi.org/10.1063/1.3518965 (2011).
Article ADS CAS PubMed Google Scholar * Meier, T., Eslami, B. & Solares, S. D. Multifrequency force microscopy using flexural and torsional modes by photothermal excitation in
liquid: Atomic resolution imaging of calcite (10(1)over-bar4). _Nanotechnology_ 27, 085702. https://doi.org/10.1088/0957-4484/27/8/085702 (2016). Article ADS CAS PubMed Google Scholar *
Ding, R.-F., Yang, C.-W., Huang, K.-Y. & Hwang, I.-S. High-sensitivity imaging with lateral resonance mode atomic force microscopy. _Nanoscale_ 8, 18421–18427.
https://doi.org/10.1039/C6NR04151E (2016). Article CAS PubMed Google Scholar * Mullin, N. & Hobbs, J. K. A non-contact, thermal noise based method for the calibration of lateral
deflection sensitivity in atomic force microscopy. _Rev. Sci. Instrum._ 85, 113703. https://doi.org/10.1063/1.4901221 (2014). Article CAS PubMed Google Scholar * Ogletree, D. F.,
Carpick, R. W. & Salmeron, M. Calibration of frictional forces in atomic force microscopy. _Rev. Sci. Instrum._ 67, 3298–3306. https://doi.org/10.1063/1.1147411 (1996). Article ADS CAS
Google Scholar * Varenberg, M., Etsion, I. & Halperin, G. An improved wedge calibration method for lateral force in atomic force microscopy. _Rev. Sci. Instrum._ 74, 3362–3367.
https://doi.org/10.1063/1.1584082 (2003). Article ADS CAS Google Scholar * Zhang, G., Li, P., Wei, D., Hu, K. & Qiu, X. Lateral force calibration for atomic force microscope
cantilevers using a suspended nanowire. _Nanotechnology_ 31, 475703. https://doi.org/10.1088/1361-6528/abae32 (2020). Article ADS CAS PubMed Google Scholar * Munz, M. Force calibration
in lateral force microscopy: A review of the experimental methods. _J. Phys. D Appl. Phys._ 43, 063001. https://doi.org/10.1088/0022-3727/43/6/063001 (2010). Article ADS CAS Google
Scholar * Kawai, S., Kitamura, S.-I., Kobayashi, D., Meguro, S. & Kawakatsu, H. An ultrasmall amplitude operation of dynamic force microscopy with second flexural mode. _Appl. Phys.
Lett._ 86, 193107. https://doi.org/10.1063/1.1923200 (2005). Article ADS CAS Google Scholar * Korolkov, V. V. _et al._ Supramolecular networks stabilise and functionalise black
phosphorus. _Nat. Commun._ 8, 1385. https://doi.org/10.1038/s41467-017-01797-6 (2017). Article ADS CAS PubMed PubMed Central Google Scholar * Santos, S., Olukan, T. A., Lai, C.-Y.
& Chiesa, M. Hydration dynamics and the future of small-amplitude AFM imaging in air. _Molecules_ 26, 7083. https://doi.org/10.3390/molecules26237083 (2021). Article CAS PubMed PubMed
Central Google Scholar * Santos, S. _et al._ Stability, resolution, and ultra-low wear amplitude modulation atomic force microscopy of DNA: Small amplitude small set-point imaging. _Appl.
Phys. Lett._ 103, 063702. https://doi.org/10.1063/1.4817906 (2013). Article ADS CAS Google Scholar * Lai, C. Y., Santos, S. & Chiesa, M. Systematic multidimensional quantification
of nanoscale systems from bimodal atomic force microscopy data. _ACS Nano_ 10, 6265–6272. https://doi.org/10.1021/acsnano.6b02455 (2016). Article CAS PubMed Google Scholar * Benaglia,
S., Amo, C. A. & Garcia, R. Fast, quantitative and high resolution mapping of viscoelastic properties with bimodal AFM. _Nanoscale_ 11, 15289–15297. https://doi.org/10.1039/c9nr04396a
(2019). Article CAS PubMed Google Scholar * Kawai, S. _et al._ Time-averaged cantilever deflection in dynamic force spectroscopy. _Phys. Rev. B_ 80, 085422.
https://doi.org/10.1103/PhysRevB.80.085422 (2009). Article ADS CAS Google Scholar * Yalcin, S. E., Legg, B. A., Yeşilbaş, M., Malvankar, N. S. & Boily, J.-F. Direct observation of
anisotropic growth of water films on minerals driven by defects and surface tension. _Sci. Adv._ 6, eaaz9708. https://doi.org/10.1126/sciadv.aaz9708 (2020). Article ADS CAS PubMed PubMed
Central Google Scholar * Abooalizadeh, Z., Sudak, L. J. & Egberts, P. Nanoscale spatial mapping of mechanical properties through dynamic atomic force microscopy. _Beilstein J.
Nanotechnol._ 10, 1332–1347. https://doi.org/10.3762/bjnano.10.132 (2019). Article CAS PubMed PubMed Central Google Scholar * Kawai, S. & Kawakatsu, H. Surface-relaxation-induced
giant corrugation on graphite (0001). _Phys. Rev. B_ 79, 115440. https://doi.org/10.1103/PhysRevB.79.115440 (2009). Article ADS CAS Google Scholar * Eslami, B. & Damircheli, M.
Biharmonic versus bimodal AFM: Numerical and experimental study on soft matter. _J. Appl. Phys._ 126, 095301. https://doi.org/10.1063/1.5116794 (2019). Article ADS CAS Google Scholar *
Zhang, Z., Ryu, S., Ahn, Y. & Jang, J. Molecular features of hydration layers probed by atomic force microscopy. _Phys. Chem. Chem. Phys._ 20, 30492–30501.
https://doi.org/10.1039/C8CP06126B (2018). Article CAS PubMed Google Scholar * Seeholzer, T., Gretz, O., Giessibl, F. J. & Weymouth, A. J. A Fourier method for estimating potential
energy and lateral forces from frequency-modulation lateral force microscopy data. _New J. Phys._ 21, 083007. https://doi.org/10.1088/1367-2630/ab3353 (2019). Article ADS CAS Google
Scholar * Weymouth, A. J. Non-contact lateral force microscopy. _J. Phys. Condens. Matter_ 29, 323001. https://doi.org/10.1088/1361-648x/aa7984 (2017). Article CAS PubMed Google Scholar
* Michel, K. H. & Verberck, B. Theory of the elastic constants of graphite and graphene. _Phys. Status Solidi B Basic Solid State Phys._ 245, 2177–2180.
https://doi.org/10.1002/pssb.200879604 (2008). Article ADS CAS Google Scholar * Hertz, H. Ueber die Berührung fester elastischer Körper. _Journal für die reine und angewandte Mathematik_
156–171, 1882. https://doi.org/10.1515/crll.1882.92.156 (1882). Article MATH Google Scholar * Blakslee, O. L., Proctor, D. G., Seldin, E. J., Spence, G. B. & Weng, T. Elastic
constants of compression-annealed pyrolytic graphite. _J. Appl. Phys._ 41, 3373–3382. https://doi.org/10.1063/1.1659428 (1970). Article ADS CAS Google Scholar * Holscher, H., Schwarz, U.
D., Zworner, O. & Wiesendanger, R. Consequences of the stick-slip movement for the scanning force microscopy imaging of graphite. _Phys. Rev. B_ 57, 2477–2481.
https://doi.org/10.1103/PhysRevB.57.2477 (1998). Article ADS CAS Google Scholar * Lee, H., Lee, N., Seo, Y., Eom, J. & Lee, S. Comparison of frictional forces on graphene and
graphite. _Nanotechnology_ 20, 325701. https://doi.org/10.1088/0957-4484/20/32/325701 (2009). Article CAS PubMed Google Scholar * Frank, I. W., Tanenbaum, D. M., Van der Zande, A. M.
& McEuen, P. L. Mechanical properties of suspended graphene sheets. _J. Vac. Sci. Technol. B_ 25, 2558–2561. https://doi.org/10.1116/1.2789446 (2007). Article CAS Google Scholar *
Zandiatashbar, A. _et al._ Effect of defects on the intrinsic strength and stiffness of graphene. _Nat. Commun._ 5, 3186. https://doi.org/10.1038/ncomms4186 (2014). Article ADS CAS PubMed
Google Scholar * Choi, J. S. _et al._ Correlation between micrometer-scale ripple alignment and atomic-scale crystallographic orientation of monolayer graphene. _Sci. Rep._ 4, 7263.
https://doi.org/10.1038/srep07263 (2014). Article CAS PubMed PubMed Central Google Scholar * Choi Jin, S. _et al._ Friction anisotropy-driven domain imaging on exfoliated monolayer
graphene. _Science_ 333, 607–610. https://doi.org/10.1126/science.1207110 (2011). Article ADS CAS PubMed Google Scholar * Gallagher, P. _et al._ Optical imaging and spectroscopic
characterization of self-assembled environmental adsorbates on graphene. _Nano Lett._ 18, 2603–2608. https://doi.org/10.1021/acs.nanolett.8b00348 (2018). Article ADS CAS PubMed Google
Scholar * Gallagher, P. _et al._ Switchable friction enabled by nanoscale self-assembly on graphene. _Nat. Commun._ 7, 1–7. https://doi.org/10.1038/ncomms10745 (2016). Article CAS Google
Scholar Download references ACKNOWLEDGEMENTS The authors thank the Deutsche Forschungsgemeinschaft (Project number 407750697) for financial support. FUNDING Open Access funding enabled and
organized by Projekt DEAL. AUTHOR INFORMATION AUTHORS AND AFFILIATIONS * Physics of Surfaces, Institute of Materials Science, Technische Universität Darmstadt, Alarich-Weiss-Str. 2, 64287,
Darmstadt, Germany Anna L. Eichhorn & Christian Dietz Authors * Anna L. Eichhorn View author publications You can also search for this author inPubMed Google Scholar * Christian Dietz
View author publications You can also search for this author inPubMed Google Scholar CONTRIBUTIONS A.L.E. extended the AFM measurement method, performed the experiments, conducted data
analysis and wrote the manuscript. A.L.E. and C.D. designed the experiment. C.D. proposed the basic idea for the method, discussed the results, and revised the manuscript. CORRESPONDING
AUTHOR Correspondence to Christian Dietz. ETHICS DECLARATIONS COMPETING INTERESTS The authors declare no competing interests. ADDITIONAL INFORMATION PUBLISHER'S NOTE Springer Nature
remains neutral with regard to jurisdictional claims in published maps and institutional affiliations. SUPPLEMENTARY INFORMATION SUPPLEMENTARY INFORMATION. RIGHTS AND PERMISSIONS OPEN ACCESS
This article is licensed under a Creative Commons Attribution 4.0 International License, which permits use, sharing, adaptation, distribution and reproduction in any medium or format, as
long as you give appropriate credit to the original author(s) and the source, provide a link to the Creative Commons licence, and indicate if changes were made. The images or other third
party material in this article are included in the article's Creative Commons licence, unless indicated otherwise in a credit line to the material. If material is not included in the
article's Creative Commons licence and your intended use is not permitted by statutory regulation or exceeds the permitted use, you will need to obtain permission directly from the
copyright holder. To view a copy of this licence, visit http://creativecommons.org/licenses/by/4.0/. Reprints and permissions ABOUT THIS ARTICLE CITE THIS ARTICLE Eichhorn, A.L., Dietz, C.
Torsional and lateral eigenmode oscillations for atomic resolution imaging of HOPG in air under ambient conditions. _Sci Rep_ 12, 8981 (2022). https://doi.org/10.1038/s41598-022-13065-9
Download citation * Received: 02 February 2022 * Accepted: 12 May 2022 * Published: 28 May 2022 * DOI: https://doi.org/10.1038/s41598-022-13065-9 SHARE THIS ARTICLE Anyone you share the
following link with will be able to read this content: Get shareable link Sorry, a shareable link is not currently available for this article. Copy to clipboard Provided by the Springer
Nature SharedIt content-sharing initiative