Acute severe hypoxia induces apoptosis of human pluripotent stem cells by a HIF-1α and P53 independent mechanism
- Select a language for the TTS:
- UK English Female
- UK English Male
- US English Female
- US English Male
- Australian Female
- Australian Male
- Language selected: (auto detect) - EN
Play all audios:

Human embryonic and induced pluripotent stem cells are self-renewing pluripotent stem cells (hPSCs) that can differentiate into a wide range of specialized cells. Although moderate hypoxia
(5% O2) improves hPSC self-renewal, pluripotency, and cell survival, the effect of acute severe hypoxia (1% O2) on hPSC viability is still not fully elucidated. In this sense, we explore the
consequences of acute hypoxia on hPSC survival by culturing them under acute (maximum of 24 h) physical severe hypoxia (1% O2). After 24 h of hypoxia, we observed HIF-1α stabilization
concomitant with a decrease in cell viability. We also observed an increase in the apoptotic rate (western blot analysis revealed activation of CASPASE-9, CASPASE-3, and PARP cleavage after
hypoxia induction). Besides, siRNA-mediated downregulation of HIF-1α and P53 did not significantly alter hPSC apoptosis induced by hypoxia. Finally, the analysis of BCL-2 family protein
expression levels disclosed a shift in the balance between pro- and anti-apoptotic proteins (evidenced by an increase in BAX/MCL-1 ratio) caused by hypoxia. We demonstrated that acute
physical hypoxia reduced hPSC survival and triggered apoptosis by a HIF-1α and P53 independent mechanism.
Human pluripotent stem cells (hPSCs), particularly human embryonic and induced pluripotent stem cells (hESCs and hiPSCs, respectively), are self-renewing cells that can differentiate into
somatic and germ cell lineages. hESCs are derived from the inner cell mass of human blastocysts, and hiPSCs are reprogrammed from somatic cells by ectopic expression of Yamanaka pluripotency
transcription factors OCT-4, SOX-2, KLF-4 and c-MYC1. hPSCs are being regarded as potential replacements for tissues in regenerative medicine and are currently used for drug discovery and
as models to study human development and diseases2,3.
Hypoxia is commonly associated with pathophysiological conditions in which oxygen concentration is inadequate to maintain cellular homeostasis. Nevertheless, embryonic stem cells, in
particular, live at low oxygen concentrations (physiologically “normal” hypoxia), which is critical for embryonic and fetal development4. Hypoxia can vary in intensity from mild to severe
and can be present in acute and chronic forms. The cellular response to oxygen deprivation is governed mainly by a group of oxygen-sensitive transcription factors, named hypoxia-inducible
factors (HIF-1α, HIF-2α/EPAS, and HIF-3α). In normoxia, HIF-1α and HIF-2α are polyubiquitinated and targeted for proteasomal degradation. Instead, in low oxygen concentrations, they are
stabilized5. Once stabilized, dimerize with HIF-1β, which is constitutively expressed, and regulate the transcription of more than 100 genes (e. g. glycolytic enzymes and survival factors)
required to cope with low oxygen tensions6,7.
Notably, exposure of hPSCs to chronic moderate hypoxia (5% O2) induces HIF-2α stabilization, which improves stemness, promotes self-renewal, and protects from spontaneous
differentiation8,9,10. This finding is not surprising given that in mammals, while the cardiovascular and hematopoietic systems are not sufficiently developed, the embryonic tissues develop
in a hypoxic environment11. In contrast, HIF-1α is stabilized in hPSCs after short hypoxic exposure9. HIF-1α can prevent cell death, and induce apoptosis or proliferation depending on the
cell type and the oxygen concentration12. However, the effects of acute severe hypoxia on hPSC viability await to be determined. Acute severe hypoxia may induce hPSC apoptosis as these cells
are mitochondrial primed and thought highly sensitive to stressful stimuli13,14. In this sense, we and others have reported that chemical compounds routinely used in vitro to mimic hypoxia
by HIF-1α stabilization and ROS generation, like cobalt chloride (CoCl2) and dimethyloxalylglycine (DMOG)15,16,17, induce apoptosis and necrosis of hPSCs and mouse embryonic stem cells
(mESCs)5,15.
In the present work, we found that exposure of hPSCs to acute severe (1% O2) hypoxia decreased cell viability. Acute 1% O2 led to HIF-1α stabilization and the appearance of apoptotic
features such as cell ballooning and detachment, increased rate of pyknotic hyperchromatic nuclei, prominent fragmentation of internucleosomal DNA, and activation of initiator CASPASE-9
(mitochondrial apoptosis pathway) and effector CASPASE-3. Notably, siRNA-mediated experiments demonstrated that the increase in cell death was independent of HIF-1α and P53. Finally, the
analysis of protein expression levels of relevant BCL-2 family members in hPSCs cultured in 1% O2 revealed an increase in BAX/MCL-1 ratio, thereby shifting the balance towards cell death.
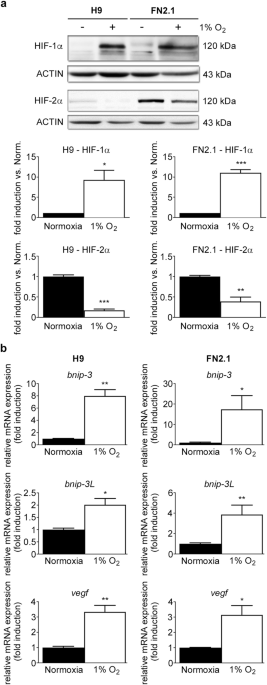
1% O2 severe cellular hypoxia was induced in H9 hESCs and FN2.1 hiPSCs grown on Vitronectin-coated cell culture dishes with fully defined Essential E8 medium (E8) by using a hypoxia
incubation chamber. Acute 1% O2 hypoxia treatment for 24 h increased HIF-1α protein expression levels, which were analyzed by western blot (Fig. 1a). Previous reports determined that HIF-2α
protein levels are stabilized in hPSCs after long-term (14 days) moderate hypoxia exposure (5% O2)9,18. Unexpectedly, we found that HIF-2α protein expression levels were significantly
reduced after incubation at 1% O2 for 24 h (Fig. 1a). Besides, mRNA expression levels of BNIP-3, BNIP-3L, and VEGF, well-known transcriptional targets of the HIF-1α/HIF-1β complex19, were
quantified by RT-qPCR to validate the hypoxic environment (Fig. 1b).
HIF-1α and HIF-2α protein expression levels upon 1% O2 incubation. (a) HIF-1α and HIF-2α protein expression levels were quantified by western blot in H9 hESCs and FN2.1 hiPSCs upon 24 h of
1% O2 incubation. ACTIN was used as loading control. Representative blots of three independent experiments are shown (full-length or original western blot images are presented in
Supplementary Fig. S8 and S9). Bar graphs represent the densitometric quantification of bands. Norm.: normoxia. Data are expressed as means + SEM fold induction relative to normoxia
(arbitrarily set as 1) and Statistical analysis was done by Student’s t-test, (*) p