Seismic monitoring of 2020 baghjan oil-well blowout incident in assam, india
- Select a language for the TTS:
- UK English Female
- UK English Male
- US English Female
- US English Male
- Australian Female
- Australian Male
- Language selected: (auto detect) - EN
Play all audios:

ABSTRACT Characterization of a productive oil/gas well blowout through seismological methods is relatively uncommon. In this paper, we conduct an in-depth seismic evaluation of one of the
world’s most significant onshore oil well blowout incidents, which occurred in 2020 at the Baghjan oil field in Assam, northeast India. We show that the blowout and related on-site
activities generated distinct signals that can be distinguished by their spectral characteristics, temporal variation in geometric spreading, and sharp attenuation of daytime noise in
comparison to the nighttime. A micro-earthquake potentially triggered by the blowout was also detected. Furthermore, we show how seismic data can be used to reasonably estimate blowout gas
exit velocity and flame height. Our results demonstrate that a detailed characterization and spatiotemporal variation of blowout activity can be successfully captured through seismic
monitoring, opening new opportunities for hazard mitigation and cost-effective disaster management for such catastrophic events. SIMILAR CONTENT BEING VIEWED BY OTHERS SPATIOTEMPORAL
EVOLUTION OF SEISMICITY DURING THE CYCLIC OPERATION OF THE HUTUBI UNDERGROUND GAS STORAGE, XINJIANG, CHINA Article Open access 24 August 2022 MYSTERIOUS SEISMOACOUSTIC SIGNALS OF EASTERN
HELWAN QUARRY BLASTS 2022 Article Open access 27 May 2025 POTENTIAL SEISMIC PRECURSORS AND SURFICIAL DYNAMICS OF A DEADLY HIMALAYAN DISASTER: AN EARLY WARNING APPROACH Article Open access 08
March 2022 INTRODUCTION Oil well blowouts resulting in the uncontrolled release of natural gas or oil have been a well-known hazard of oil and gas exploration and production. Although the
largest known blowouts have occurred offshore1,2, the limited data available suggests that onshore wells are more prevalent and may experience higher failure rates3, possibly due to older
infrastructure and not as much oversight4. Davies et al. documented over 4 million onshore wells with failure rates from 2 to 75% across just nine nations with acceptably reliable data
(i.e., Australia, Austria, Bahrain, Brazil, Canada, the Netherlands, Poland, UK, USA), though these numbers likely underestimate true rates due to poor reporting3. Onshore wells are also at
higher risk than offshore wells of contaminating groundwater, surface water, and wetland ecosystems, and pose a higher direct hazard to human life4. As oil well infrastructure ages, the need
for enhanced remote monitoring strategies is growing. Here we report a novel case study documenting, to our knowledge, the first use of passive seismic monitoring to track the
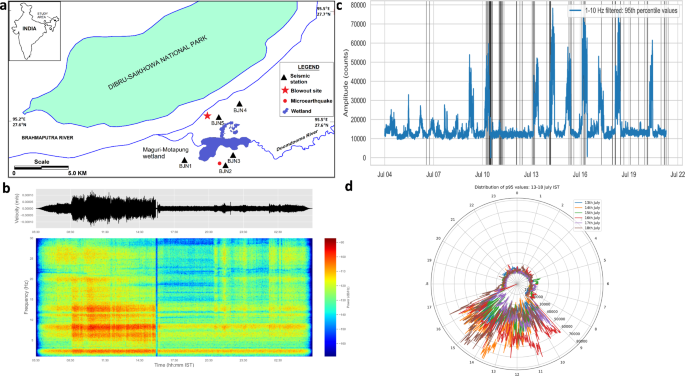
characteristics of an active blowout event. On May 27, 2020, oil well no. 5 of the Baghjan oil field (operated by Oil India Limited (OIL)) in the Tinsukia district of Assam experienced one
of the most severe onshore blowouts in the world (see Fig. 1a, and Supplemental Material). The event ignited a catastrophic jet fire that raged at temperatures exceeding 1000 °C from June 9
to November 15, 2020, causing widespread evacuations and a few fatalities, with an estimated USD 3.2 billion of ecological damages5. The blowout had far-reaching consequences, not only on
the environment but also on noise pollution and ground vibrations, soil and water pollution, and thermal pollution that significantly impacted the lives of the nearby communities. The fire
at the blowout well, sourced by uninterrupted upwelling of natural gas and condensate at more than 4,000 psi, perpetually flamed with an average height of 108 m. The spontaneous noise
produced from the well, similar to that of the sound of a jet-engine, reached more than 100 dB within 100 m radius and more than 50 dB within 5 km radius. The flames of the blowout raised
the heat of both the air and water of the surrounding area by ~ 7 °C above the ambient temperature, amounting to thermal pollution. In the aftermath of this event, it has also resulted in
the loss of an estimated 55 per cent of the biodiversity in the affected Dibru-Saikhowa National Park. As many as 1,632 hectares of wetland, 523 ha of grassland, 172 ha of area covering
rivers and streams, and 213 ha of forest were damaged to varying degrees based on the proximity of the ecosystem to the blowout6. Experts say it may take more than 10 years for even a
partial recovery of the destruction caused to the landscape7. To the best of our knowledge, this event is one of the worst onshore blowout-fueled jet fires that has been documented in
history6 and therefore warrants multidisciplinary studies which can help in prevention and mitigation of such accidents in the future. Here, we investigate characteristics of seismo-acoustic
noise, in particular “air-ground-coupled-air” waves (AGCA)8,9,10 generated by the blowout, as well as related activities, captured on a temporary broadband seismic network. Our results
provide new insights into blowout conditions and highlight the potential advantages of employing seismo-acoustic monitoring for remote detection and management of blowout events and related
activities. A literature review on similar events, such as explosions and gas pipeline bursts, highlights the distinctive advantages of using seismic data in studying these occurrences,
offering insights that few other methods can provide. Koper et al.11 discuss seismic recordings of a natural gas pipeline explosion in Carlsbad, New Mexico, on August 19, 2000. Their study
analyzed the recorded seismic signals during which they identified three impulsive events and two extended seismic events related to the explosion and continuous emanation of the flaming
gases, respectively. Their study provided insights into the nature and timing of the pipeline explosion event. The seismic analysis was valuable for law enforcement agencies investigating
this incident and for litigation processes. A related study by Stahler et al.12 investigated recorded seismic events linked to the Nordstream pipeline subsea explosions in the Baltic Sea.
They located two significant seismic events near the observed methane plumes by analyzing the polarization of seismic signals from multiple stations. This study is an example of the
application of seismology in locating the explosions and thus establishing the cause of the pipeline burst, which is useful for mitigating the harmful effects of such explosions. The Barros
et al.13 study of the 2020 Beirut explosion, one of the largest non-nuclear explosions in history, employed seismic and infrasound data for their investigation. Their study estimated the
explosion’s epicenter, magnitudes, and explosive yield highlighting the joint analysis of seismo-acoustic signals to better understand and quantify large-scale explosions. Another study
which follows a similar methodology, Evers et al.14 investigates a gas pipeline explosion near Ghislenghien, Belgium, using seismo-acoustic methods. Their analysis used array-processing
techniques and atmospheric models to determine the explosion’s origin time and location and yield using data from several seismic and infrasound stations. A similar study by Schneider et
al.15 investigates the Baumgarten gas explosion in Austria using seismo-acoustic methods. The study describes the explosion’s characteristics by analyzing data from seismic and infrasound
stations and modeling ray paths in the atmosphere. These studies highlight the effectiveness of seismic and acoustic methods in forensic investigations of analyzing non-tectonic seismic
events such as explosions, which is important to people and society. Seismological studies of explosions, therefore provide insights for future mitigation and response strategies along with
the scientific characterization of the events. The information that these studies provide, such as the precise location and timing of explosions, is useful for law enforcement and
investigative agencies. These studies also help us understand the dynamics of explosions, which can help formulate safety protocols and standards customized for a specific operation or area.
Therefore, integrating seismological monitoring program into safety and planning frameworks is an important component of explosion risk management. The preliminary report on the Baghjan gas
blowout by the Central Pollution Control Board, Government of India (2020) also highlights concerns regarding the seismic vulnerability of the region in the wake of the gas blowout, which
motivated the seismic monitoring that forms the basis of this study. The northeastern state of Assam, India, where the gas blowout took place, is a region prone to seismic activity, having
recorded many earthquakes in the past16,17,18,19. The continuous gas blowouts and further drilling attempts to bring it under control could also have potentially generated induced
seismicity, so monitoring with local seismic stations was necessary. Fluvial floodplains and wetlands characterize the local landscape of the region, which would also have amplified ground
motion in the case of any induced seismicity, making this area particularly susceptible to damage from seismic activity. The same report also highlights that constant tremor related to the
gas blowout caused significant damage to the area’s infrastructure, roads, and homes. These vibrations had adversely affected the local community, causing physical and mental stress,
disrupting education and livelihood, and impacting the health of residents. After the blowout was subdued, seismological monitoring provided data on the intensity and frequency of these
tremors that can be used for remedial and compensatory relief measures. The impact of this gas blowout was severe enough to warrant other studies using remote sensing data to study the
environmental impact (Arandhara et al.20). Our seismological study of the event enhances the damage assessment by showcasing the extent of ground vibrations and its variations in space and
time, that can affect nearby structures and ecosystems. In this case, seismological studies complement conventional environmental assessment techniques and taken together offer a more
comprehensive understanding of the blowout’s impact on the surrounding sensitive ecosystem. FIRST DETECTION OF AN ONSHORE BLOWOUT-TRIGGERED EARTHQUAKE? Earthquakes induced by oil and gas
extraction activities are a known phenomenon21,22,23. Here we investigate whether earthquakes might have been induced by the Baghjan blowout. Our data showcases the first reported
micro-earthquake associated with a blowout event, at a distance of about 5 km south of the well and at a depth of ~ 1.9 km (Mc 0.5, Fig. 1a). Based on a global compilation of injection
well-induced earthquakes, Goebel and Brodsky24 showed that many such earthquakes occur at distances from the well ranging from 10 m to over 10 km. The triggering mechanism of induced
earthquakes are, however, not yet fully understood, and exceptions exist such as the Bakken Shale Formation in North Dakota, which has experienced little to no induced seismicity despite
thousands of injection wells being in operation there25,26. Thus, given that we do not yet have a fully-developed understanding of a possible blowout inducing mechanism as in the injection
well induced case, we can only speculate that this earthquake at ~ 5 km distance from the blowout might be what we refer to here as a “blowout quake.” If the blowout did indeed trigger this
earthquake, this might represent the first recorded earthquake directly linked to a well blowout. The earthquake’s shallow depth further suggests it could be an induced phenomenon.
Identifying the exact cause of this “blowout quake” remains challenging, though rapid changes in subsurface pore pressure resulting from the blowout are a plausible explanation.
Additionally, the shutdown of nearby wells during the blowout could have forced fluids to migrate, potentially altering the pore pressure conditions. TYPE OF NOISE Frequency-domain analysis
of the seismic data recorded in this study reveals the presence of high-energy monochromatic signals, which we interpret as stemming from human activity, such as the use of electric
generators and water pumps during fire-fighting efforts. Conversely, the broad pulses detected could likely be linked to mini-explosion—sudden fluctuations in the gas jet flux emanating from
the blowout well. The estimated maximum Peak Particle Velocity (PPV) was 0.22 mm/s at the nearest station (BJN5) and the minimum was 0.095 mm/s at a farther station (BJN3). We observe a
clear daily variation in seismic amplitude (Fig. 1b–d), with high noise levels lasting ~ 8 h per day during typical daytime working hours and lulls over nights and weekends, indicating that
high amplitudes correspond with human activities. Because most human activity in this area throughout the study involved fire suppression at the blowout site, the majority of this noise was
likely generated by a combination of fire suppression activities, continuous gas blowout and continuously operating machines such as water pumps. Evenings and weekends are typically
characterized by continuous lower levels of noise likely dominated by noise generated by uncontrolled release of gas, as well as water pumps that ran continuously throughout the study
period, creating a ‘water-umbrella’ to manage temperatures in the blowout site27. At several times throughout the study period, noise levels dropped dramatically for several minutes. Outside
of these quiet periods, clear amplitude peaks at 2–3 Hz and 5–8 Hz are observed at nearly all seismic stations (Fig. 1b), visible as prominent spectral stripes in a daylong spectrogram
(Fig. 1b). These bands disappear during periods of reduced noise, when energy is distributed relatively evenly over 1–10 Hz. We therefore interpret the 2–3 Hz and 5–8 Hz bands as
blowout-generated noise. During working hours, the noise level is elevated over broad frequency bands, typically 1–30 Hz, which we infer to be caused by people actively working and operating
machines at the blowout site. We also observe several distinct impulse signals throughout the study period. One of the clearest impulse signals was recorded on July 16, 2020 (Fig. 1b), at
the end of a period of reduced noise. Vertical and radial component seismograms of this pulse show relatively high energy with little energy on the transverse component (Fig. 2a). Particle
motion also shows elliptical motion in the vertical-radial plane (Fig. 2b) suggesting that the pulse is composed of Rayleigh waves. Spectral characteristics of the pulse match the 2–3 and
5–8 Hz bands found during times of active gas blowout, suggesting that the noise produced by the gas blowout is also dominated by Rayleigh waves (Fig. 2c). We use this impulsive
mini-explosion signal as a template and apply a match filter technique to identify similar pulses during the 17-day study period. Such impulse signals typically occur in clusters and are
observed sporadically throughout the duration studied here, both at day and night times, suggesting they are likely smaller explosions producing weak pulses of AGCA Rayleigh waves. It is
important to note that the frequency bands can vary depending on the individual characteristics of the blowout event and the surrounding geological environment. In this case, the blowout
site is located at soft alluvium where the predominant frequency of the site is lower, thus the appearance of prominent spectral stripes at lower frequencies. Had it been a rocky site, the
predominant frequency of the site could have been higher, thus influencing the prominent spectral stripes. A more comprehensive analysis, including additional data (e.g., recording of
background seismic noise after controlling the blowout at the same locations where recording was done during blowout) and modeling, would be necessary to provide a definitive explanation for
the observed frequency bands. NOISE ATTENUATION We use the blowout as the assumed source of noise and determine its seismic attenuation, which we attribute to be mostly geometrical
spreading, and its diurnal variation. Near the source, geometrical spreading is the dominant factor that determines how ground shaking decays with distance28. Ground shaking is controlled by
the source, path, and near-surface site conditions. During the study period, path and site conditions remain nearly unchanged. Thus, geometrical spreading is an important element of
modeling predicted ground motion in an area29,30. It is typically determined by analyzing natural earthquakes data18,19,20. In this case, however, we took a novel approach of determining
geometrical spreading from a coherent, near-continuous and strong noise source. Time also provides an additional dimension in this study, as the noise characteristics change throughout the
day. As discussed earlier in detail, there are three types of noise recorded here. Here, we determine geometrical spreading separately using different types of noise occurring in different
time periods and compare them. Surprisingly, geometrical spreading appears to vary over time in the study area, which as described below can be explained by different types of waves (body
waves and surface waves) mixed in different proportions dominating the ground motion at different times (Fig. 2d; Table 1). Amplitudes of seismic surface and body waves theoretically decay
at R−0.5 and R−1, respectively, where R is distance from the source. Noise in this study is dominated by the blowout, which is by far the strongest continuous source of noise in the study
area. Generally, we find that the amplitude of noise in the study area decays at a rate close to R−0.5 indicating that the wavefield is dominated by surface waves (Fig. 2d) as suggested by
previous analyses of the impulse signal. Surface waves from the blowout are the main source of noise during nighttime periods (R−0.46). Daytime amplitude decay consistently shows steeper
slopes(R−0.61) compared to nighttime even though the amplitude is higher compared to nighttime (Fig. 2d). We can conceive of no mechanistic reason for surface wave amplitudes to decay faster
with distance during the day, and therefore infer that the apparent increase in decay rate results from the near-field signal being a combination of body waves produced by human activities
during the day superposed on surface waves from the blowout. The impulse signal detected on July 16, 2020 occurred during daytime at around 16:00 h (IST) and decays at a rate of R−0.581,
suggesting that higher amplitude surface waves from the impulse are reducing the relative dominance of daytime anthropogenic body waves. This observation supports our conclusion that the
impulse is likely a result of small explosion during blowout. We have performed this analysis over various frequency ranges spanning 1 to 30 Hz. The highest concentration of energy is
observed below 10 Hz, although considerable energy can be seen up to 30 Hz as well. Increasing frequency from 10 Hz to 30 Hz, however, does not change the decay slope significantly, implying
that even at higher frequencies surface waves dominate the wavefield (Fig. 2d). This is because inelastic attenuation is nonlinear and higher frequencies decay with distance at a faster
rate. We thus conclude that, geometrical spreading is likely the controlling factor for amplitude decay at this distance. Notably, the decay rate during one of the short periods of reduced
noise is almost flat suggesting no strong coherent source of noise active in the area during this calm period. This suggests that more localized noise dominates the wavefield around each
seismometer during these times, supporting our conclusion that the calm periods reflect short pauses or significant reductions of the blowout. This is a reasonable interpretation considering
that crews were trying to plug the blowout during this time. SOURCE CHARACTERIZATION The arrival times of the pulse that occurred on July 16, 2020 could be precisely picked at different
stations of the network (Fig. 3a). Joint inversion of these arrival times for source location and propagation velocity indicates acoustic waves that originated from a source located at the
blowout site. (Fig. 3b,c). The continuous background noise exhibits the largest coherence over the 1–3 Hz frequency band (Fig. 4a), which corresponds to the stationary vibrations also
observed in the daylong spectrograms of Fig. 1b. Coherency analysis is utilized to derive accurate estimates of differential travel times between stations. The inversion of these times
reveals a stationary source location, which coincides with the blowout site. The amplitude of the signal exhibits a characteristic daily pattern, likely reflecting the disturbances generated
by the fire extinguishing operations (Fig. 4b), as described in previous sections in detail. The composite location map shown in Fig. 4c exhibits a pronounced peak at the blowout site, with
average discrepancies of approximately 50 m and 150 m along the east-west (EW) and north-south (NS) directions, respectively. These discrepancies arise due to deviations from the
assumptions of constant sound velocity and a static atmosphere, which we initially adopted for predicting travel times. ESTIMATING JET CHARACTERISTICS Our analyses suggest that the blowout
generated AGCA Rayleigh waves which are acoustic waves that impinge on the Earth’s surface and generate (i.e., couple to the ground as) seismic surface waves31,32,33. Similar signals are
frequently produced by volcanic eruptions so acoustic infrasound recordings have been extensively utilized in monitoring and surveillance of active volcanoes to detect eruptions in remote
locations, measure eruptive parameters, and infer eruption source processes34,35. The acoustic power radiated during gaseous volcanic eruptions has been shown to correlate positively with
gas exit velocity, in turn exhibiting a positive correlation with ash plume height. We apply this theory described for volcanic jet aeroacoustics36 to the gas explosion of the Baghjan
blowout. Assuming that the ground motion is linked to AGCA waves, we use seismic recordings from each station to estimate the infrasonic acoustic pressure at the source. As a result, we
obtain estimates for the gas exit velocity, which is approximately 1260 m/s, and the flame height, which is approximately 97 m. (See _Methods_, in _Supplementary Material_ for a complete
description of this analysis.). Despite the use of several simplifying assumptions in this approach (Methods), these model results are remarkably consistent with field-reported values of ~
1000 m/s and ~ 100 m, respectively (Table 2 in Supplementary Material)6. CONCLUSIONS In this study, we analyzed continuous recordings of seismic noise collected by a temporary seismic
network installed within a 10 km radius of the Baghjan well blowout site for a total duration of 17 days. Our analysis documents details of the characteristics of seismic data recorded in
the vicinity of the blowout, and also documents what we conclude to be the first known case of a blowout microearthquake. This documentation contributes to a growing database and
understanding of how seismological analysis elucidates the phenomenon of oil and gas well blowout accidents. Further investigation of past and future seismic data recorded in the vicinity of
blowouts will help determine whether such events are common, and could contribute to our growing knowledge of the mechanics and mitigation strategies for these types of oil and gas well
explosion accidents, as well as for other environmental hazards associated with oil and natural gas producing facilities, such as the well-known conundrum of injection-induced earthquakes.
The precise source locations and detailed source property characteristics obtained in this study indicate that densely distributed permanent or temporary seismic networks can effectively
supplement existing, but sparsely located, infrasound arrays. This approach provides valuable information for identifying and locating infrasonic blowout sources at both local and regional
scales. Several lines of evidence suggest that sustained ground vibrations observed in the 2–3 Hz and 5–8 Hz bands are likely associated with the propagation of blowout-generated acoustic
waves dynamically coupled to the ground as Rayleigh waves. Our estimates of gas jet velocity and flame height obtained from acoustic power suggest that seismic instruments could provide a
real-time tool to inform emergency response personnel regarding pragmatic intervention through quantitative monitoring of such events. Our detection of explosion clustering also suggests the
potential for future development of seismic early warning systems to improve safety measures for disaster response crews. To the best of our knowledge, no studies have previously documented
seismic signals during an active and continuous blowout of an oil/gas well. However, dense seismic arrays are currently used in several oil producing countries for monitoring the activity
of producing oil and gas wells37,38, providing a convenient pathway to adapt existing resources for emergency monitoring. This work thus paves the way to a vast array of seismological
applications for the rapid assessment and ongoing monitoring of hazardous phenomena. DATA AVAILABILITY The raw seismic Data can be provided with a request to the Director, CSIR-NEIST Jorhat
at [email protected] via Gmail Drive. The link of the Gmail drive is https://drive.google.com/drive/folders/1c8n1ckVUbcbzp7FHM68BqJFNDxyu7BHy in main manuscript. REFERENCES *
Danenberger, E. P. Outer continental shelf drilling blowouts, 1971–1991. In _All Days_ OTC-7248-MS (OTC, 1993). https://doi.org/10.4043/7248-MS. * Hickman, S. H. et al. Scientific basis for
safely shutting in the Macondo Well after the April 20, 2010 _Deepwater Horizon_ blowout. _Proc. Natl. Acad. Sci._ 109, 20268–20273 (2012). Article ADS PubMed PubMed Central CAS Google
Scholar * Davies, R. J. et al. Oil and gas wells and their integrity: Implications for shale and unconventional resource exploitation. _Mar. Pet. Geol._ 56, 239–254 (2014). Article Google
Scholar * King, G. E. & King, D. E. Environmental risk arising from well-construction failure—Differences between barrier and well failure, and estimates of failure frequency across
common well types, locations, and well age. _SPE Prod. Oper._ 28, 323–344 (2013). CAS Google Scholar * Swaddle, T. & Naraharisetty, R. Biodiversity loss due to Assam’s Baghjan oil
disaster could take decades to recover: Report. _The Swaddle_. https://theswaddle.com/biodiversity-loss-due-to-assams-baghjan-oil-disaster-could-take-decades-to-recover-report/ (2021). *
Yadava, M. K. _One Man Enquiry Committee Report on Damages to Environment, Biodiversity, Wildlife, Forest and Ecology on account of Blow out and Explosion at OIL Well No. BGN-5, Baghjan,
Tinsukia, Assam, India,_ vol. I, 512 http://webservers.amtron.in/demo/baghjan/ (2021). * Ghosh, R. G. & Ghosh, S. In Assam, biodiversity loss due to the Baghjan oil blowout could take at
least a decade to recover. _Scroll.in_. https://scroll.in/article/999437/in-assam-biodiversity-loss-due-to-the-baghjan-oil-blowout-could-take-at-least-a-decade-to-recover (2021). * Fee, D.
et al. Seismic envelope-based detection and location of ground-coupled airwaves from volcanoes in Alaska. _Bull. Seismol. Soc. Am._ 106, 1024–1035 (2016). Article Google Scholar *
Ichihara, M., Yamakawa, K. & Muramatsu, D. A simple method to evaluate the air-to-ground coupling efficiency: A tool helping the assessment of seismic/infrasonic energy partitioning
during an eruption. _Earth Planets Space_ 73, 180 (2021). Article ADS Google Scholar * Bishop, J. W., Fee, D., Modrak, R., Tape, C. & Kim, K. Spectral element modeling of acoustic to
seismic coupling over topography. _J. Geophys. Res. Solid Earth_ 127, e2021JB023142 (2022). Article ADS Google Scholar * Koper, K. D., Wallace, T. C. & Aster, R. C. Seismic recordings
of the Carlsbad, New Mexico, pipeline explosion of 19 August 2000. _Bull. Seismol. Soc. Am._ 93(4), 1427–1432 (2003). Article Google Scholar * Stähler, S. C., Zenhäusern, G., Clinton, J.,
& Giardini, D. Locating the Nordstream explosions without a velocity model using polarization analysis. arXiv preprint https://arxiv.org/abs/2210.04585 (2022). * Barros, L. V. et al.
Seismo-acoustic signal analysis and yield estimate of the Beirut, Lebanon, accidental explosion on August 4, 2020. _Brazilian Journal of Geophysics_ 39(4), 629–644 (2021). Article Google
Scholar * Evers, L. G., Ceranna, L., Haak, H. W., Le Pichon, A. & Whitaker, R. W. A seismoacoustic analysis of the gas-pipeline explosion near Ghislenghien in Belgium. _Bull. Seismol.
Soc. Am._ 97(2), 417–425 (2007). Article Google Scholar * Schneider, F. M. et al. Seismo-acoustic signals of the Baumgarten (Austria) gas explosion detected by the AlpArray seismic
network. _Earth Planet. Sci. Lett._ 502, 104–114 (2018). Article ADS CAS Google Scholar * Ben-Menahem, A., Aboodi, E. & Schild, R. The source of the great Assam earthquake—an
interplate wedge motion. _Phys. Earth Planet. Interiors_ 9(4), 265–289 (1974). Article ADS Google Scholar * England, P. & Bilham, R. The Shillong Plateau and the great 1897 Assam
earthquake. _Tectonics_ 34(9), 1792–1812 (2015). Article ADS Google Scholar * Kayal, J. R. et al. Large and great earthquakes in the Shillong plateau–Assam valley area of Northeast India
Region: Pop-up and transverse tectonics. _Tectonophysics_ 532, 186–192 (2012). Article ADS Google Scholar * Khattri, K. N. Great earthquakes, seismicity gaps and potential for earthquake
disaster along the Himalaya plate boundary. _Tectonophysics_ 138(1), 79–92 (1987). Article ADS Google Scholar * Arandhara, B., Shukla, J. & Dhyani, S. Damage assessment of Baghjan oil
field blowout on terrestrial and aquatic ecosystems near Dibru Saikhowa Biosphere Reserve, Assam India. _Remote Sens. Appl. Soc. Environ._ 31, 100999 (2023). Google Scholar * Ellsworth, W.
L. Injection-induced earthquakes. _Science_ 341, 1225942 (2013). Article PubMed Google Scholar * Keranen, K. M., Weingarten, M., Abers, G. A., Bekins, B. A. & Ge, S. Sharp increase
in central Oklahoma seismicity since 2008 induced by massive wastewater injection. _Science_ 345, 448–451 (2014). Article ADS PubMed CAS Google Scholar * Guglielmi, Y., Cappa, F.,
Avouac, J.-P., Henry, P. & Elsworth, D. Seismicity triggered by fluid injection–induced aseismic slip. _Science_ 348, 1224–1226 (2015). Article ADS PubMed CAS Google Scholar *
Goebel, T. H. W. & Brodsky, E. E. The spatial footprint of injection wells in a global compilation of induced earthquake sequences. _Science_ 361, 899–904 (2018). Article ADS
MathSciNet PubMed CAS Google Scholar * Weingarten, M., Ge, S., Godt, J. W., Bekins, B. A. & Rubinstein, J. L. High-rate injection is associated with the increase in U.S.
mid-continent seismicity. _Science_ 348, 1336–1340 (2015). Article ADS PubMed CAS Google Scholar * Verdon, J. P., Kendall, J.-M., Horleston, A. C. & Stork, A. L. Subsurface fluid
injection and induced seismicity in southeast Saskatchewan. _Int. J. Greenh. Gas Control_ 54, 429–440 (2016). Article CAS Google Scholar * Das, G. _After Big Blowout, Assam’s Baghjan Oil
Field Catches Fire_. https://thewire.in/environment/assam-tinsukia-baghjan-oil-field-blowout-catches-fire. * Wu, Q., Chapman, M. C., Beale, J. N. & Shamsalsadati, S. Near-source
geometrical spreading in the central Virginia seismic zone determined from the aftershocks of the 2011 mineral, Virginia, earthquake. _Bull. Seismol. Soc. Am._ 106, 943–955 (2016). Article
Google Scholar * Frankel, A. Decay of _S_-wave amplitudes with distance for earthquakes in the Charlevoix, Quebec, Area: Effects of radiation pattern and directivity. _Bull. Seismol. Soc.
Am._ 105, 850–857 (2015). Article Google Scholar * Sedaghati, F. & Pezeshk, S. Estimation of the coda-wave attenuation and geometrical spreading in the New Madrid seismic zone. _Bull.
Seismol. Soc. Am._ 106, 1482–1498 (2016). Article Google Scholar * Donn, W. L., Pfeffer, R. L. & Ewing, M. Propagation of air waves from nuclear explosions: Nuclear explosions provide
data on the relation of air-wave propagation to atmospheric structure. _Science_ 139, 307–317 (1963). Article ADS PubMed CAS Google Scholar * Bolt, B. A. Seismic air waves from the
great 1964 Alaskan earthquake. _Nature_ 202, 1095–1096 (1964). Article ADS Google Scholar * Arrowsmith, S. J., Johnson, J. B., Drob, D. P. & Hedlin, M. A. H. The seismoacoustic
wavefield: a new paradigm in studying geophysical phenomena. _Rev. Geophys._ 48, RG4003 (2010). Article ADS Google Scholar * Donn, W. L. & Balachandran, N. K. Mount St. Helens
Eruption of 18 May 1980: Air waves and explosive yield. _Science_ 213, 539–541 (1981). Article ADS PubMed CAS Google Scholar * Morrissey, M. M. & Chouet, B. A. Burst conditions of
explosive volcanic eruptions recorded on microbarographs. _Science_ 275, 1290–1293 (1997). Article PubMed CAS Google Scholar * Matoza, R. S., Fee, D., Neilsen, T. B., Gee, K. L. &
Ogden, D. E. Aeroacoustics of volcanic jets: Acoustic power estimation and jet velocity dependence: Volcanic jet aeroacoustics. _J. Geophys. Res. Solid Earth_ 118, 6269–6284 (2013). Article
ADS Google Scholar * Das, I. & Zoback, M. D. Long-period, long-duration seismic events during hydraulic stimulation of shale and tight-gas reservoirs—Part 1: Waveform
characteristics. _Geophysics_ 78, KS97–KS108 (2013). Article Google Scholar * Hu, H., Li, A. & Zavala-Torres, R. Long-period long-duration seismic events during hydraulic fracturing:
Implications for tensile fracture development. _Geophys. Res. Lett._ 44, 4814–4819 (2017). Article ADS Google Scholar Download references ACKNOWLEDGEMENTS We thank Government of Assam for
help rendered during execution of the project. CSIR, Govt. of India is also thankfully acknowledge for their help and necessary permission. Oil India Limited (OIL), Duliajan, Assam, India
provided financial support via Ref No. OIL/CONT/LOA/G/134/2020-21; date: 24/06/2020. Thanks to all the project members for executing the project during CoVID-19 pandemic period. Special
thanks to Dr. Saurabh Baruah, Chief Scientist, CSIR-NEIST Jorhat and Mr. I. Baruah, OIL, Duliajan, Assam, India for their help in executing the project. We thank the anonymous reviewers and
Editor for their constructive comments in improving the paper. Thanks to Dr. V. M. Tiwari, Director, CSIR-NEIST, Jorhat, Assam, India for his permission to publish this article. AUTHOR
INFORMATION AUTHORS AND AFFILIATIONS * CSIR-North East Institute of Science and Technology, Jorhat, Assam, 785006, India Santanu Baruah, Manoj K. Phukan, G. Narahari Sastry, Sausthov M.
Bhattacharyya, Chandan Dey, Kimlina Gogoi, Timangshu Chetia & Prachurjya Borthakur * Academy of Scientific and Innovative Research, Ghaziabad, Uttar Pradesh, 201 002, India Santanu
Baruah, Kimlina Gogoi & Prachurjya Borthakur * Department of Earth and Planetary Sciences, University of California, Riverside, USA Shankho Niyogi & Abhijit Ghosh * Istituto
Nazionale di Geofisica e Vulcanologia - Sezione di Pisa, Via C. Battisti, Pisa, Italy Davide Piccinini & Gilberto Saccorotti * Department of Earth and Environmental Sciences, Boston
College, Chestnut Hill, MA, 02467, USA Alan L. Kafka * Cooperative Institute for Research in Environmental Sciences (CIRES), University of Colorado Boulder, Boulder, USA Danica Roth *
Environment and Forest Department, Government of Assam, Guwahati, India Mahendra Kumar Yadava * Department of Biotechnology, Indian Institute of Technology-Hyderabad, Kandi, Telangana,
502285, India G. Narahari Sastry * Geohazards Research Centre, King Abdulaziz University, Jeddah, Saudi Arabia Mohamed F. Abdelwahed * Formerly at Geological Survey of India, Kolkata, India
J. R. Kayal * National Institute of Technology-Agartala, Agartala, Tripura, 799046, India J. R. Kayal * Department of Geosciences, University of Malta, Msida, MSD, 2080, Malta Sebastiano
D’Amico * Assam State Disaster Management Authority (ASDMA), Assam Secretariate, Government of Assam, Dispur, Guwahati, Assam, 781005, India Nandita Dutta * Institute of Seismological
Research, Government of Gujarat, Gandhinagar, Gujarat, 382009, India Sowrav Saikia Authors * Santanu Baruah View author publications You can also search for this author inPubMed Google
Scholar * Shankho Niyogi View author publications You can also search for this author inPubMed Google Scholar * Abhijit Ghosh View author publications You can also search for this author
inPubMed Google Scholar * Davide Piccinini View author publications You can also search for this author inPubMed Google Scholar * Gilberto Saccorotti View author publications You can also
search for this author inPubMed Google Scholar * Alan L. Kafka View author publications You can also search for this author inPubMed Google Scholar * Danica Roth View author publications You
can also search for this author inPubMed Google Scholar * Mahendra Kumar Yadava View author publications You can also search for this author inPubMed Google Scholar * Manoj K. Phukan View
author publications You can also search for this author inPubMed Google Scholar * G. Narahari Sastry View author publications You can also search for this author inPubMed Google Scholar *
Mohamed F. Abdelwahed View author publications You can also search for this author inPubMed Google Scholar * J. R. Kayal View author publications You can also search for this author inPubMed
Google Scholar * Sausthov M. Bhattacharyya View author publications You can also search for this author inPubMed Google Scholar * Chandan Dey View author publications You can also search
for this author inPubMed Google Scholar * Kimlina Gogoi View author publications You can also search for this author inPubMed Google Scholar * Timangshu Chetia View author publications You
can also search for this author inPubMed Google Scholar * Prachurjya Borthakur View author publications You can also search for this author inPubMed Google Scholar * Sebastiano D’Amico View
author publications You can also search for this author inPubMed Google Scholar * Nandita Dutta View author publications You can also search for this author inPubMed Google Scholar * Sowrav
Saikia View author publications You can also search for this author inPubMed Google Scholar CONTRIBUTIONS S.B. conceptualized the work. S.B., A.G., D.P., G.S. J.R.K., C.D. wrote the original
manuscript. S.B., A.L.K., D.R., S.M.B., M.F.A., S.D.A. performed the seismic analysis. S.B., A.G., S.N. and S.M.B. performed the noise analysis. D.P., G.S. performed the infrasound
analysis. S.B., M.K.P., S.M.B., and C.D. performed the field surveys including data generation and collection. M.K.Y. performed various survey related to study of the flame, pollution,
impact assessment and other. S.B., M.K.P., G.N.S. assisted with the project management and field work coordination. Thorough check-up of the results obtained are performed by: S.B., A.G.,
D.P., G.S., A.L.K., D.R., M.F.A., S.D.A. The manuscript was reviewed by S.B., A.L.K., D.R., J.R.K. and G.N.S. The manuscript has been formatted and figures have been comprehensively detailed
by S.B., K.G., T.C., P.B., N.D., and S.S. All authors interpreted and discussed the final results, and edited, reviewed and approved the final manuscript. CORRESPONDING AUTHORS
Correspondence to Santanu Baruah, Abhijit Ghosh or Gilberto Saccorotti. ETHICS DECLARATIONS COMPETING INTERESTS The authors declare no competing interests. ADDITIONAL INFORMATION PUBLISHER’S
NOTE Springer Nature remains neutral with regard to jurisdictional claims in published maps and institutional affiliations. ELECTRONIC SUPPLEMENTARY MATERIAL Below is the link to the
electronic supplementary material. SUPPLEMENTARY MATERIAL 1 RIGHTS AND PERMISSIONS OPEN ACCESS This article is licensed under a Creative Commons Attribution-NonCommercial-NoDerivatives 4.0
International License, which permits any non-commercial use, sharing, distribution and reproduction in any medium or format, as long as you give appropriate credit to the original author(s)
and the source, provide a link to the Creative Commons licence, and indicate if you modified the licensed material. You do not have permission under this licence to share adapted material
derived from this article or parts of it. The images or other third party material in this article are included in the article’s Creative Commons licence, unless indicated otherwise in a
credit line to the material. If material is not included in the article’s Creative Commons licence and your intended use is not permitted by statutory regulation or exceeds the permitted
use, you will need to obtain permission directly from the copyright holder. To view a copy of this licence, visit http://creativecommons.org/licenses/by-nc-nd/4.0/. Reprints and permissions
ABOUT THIS ARTICLE CITE THIS ARTICLE Baruah, S., Niyogi, S., Ghosh, A. _et al._ Seismic monitoring of 2020 Baghjan oil-well blowout incident in Assam, India. _Sci Rep_ 14, 24108 (2024).
https://doi.org/10.1038/s41598-024-74428-y Download citation * Received: 30 November 2023 * Accepted: 26 September 2024 * Published: 15 October 2024 * DOI:
https://doi.org/10.1038/s41598-024-74428-y SHARE THIS ARTICLE Anyone you share the following link with will be able to read this content: Get shareable link Sorry, a shareable link is not
currently available for this article. Copy to clipboard Provided by the Springer Nature SharedIt content-sharing initiative KEYWORDS * Baghjan oil-blowout * Blowout quake * Rayleigh waves *
Air-ground-coupled air waves (AGCA)