Assessment of the suitability of drought descriptions for wildfires under various humid temperate climates in japan
- Select a language for the TTS:
- UK English Female
- UK English Male
- US English Female
- US English Male
- Australian Female
- Australian Male
- Language selected: (auto detect) - EN
Play all audios:

ABSTRACT Drought is the primary driver of wildfires in humid regions, and the main drought drivers for wildfire occurrence and spread vary across different humid climatic areas. This study
explores the suitability of different drought descriptions for wildfires under various humid temperate climates in Japan. Based on wildfire data from 1995 to 2012, statistical and
correlation analyses were conducted to examine the performance of effective humidity (EH) and soil moisture (SM) as indicators of atmospheric and soil drought. EH is used for nationwide
wildfire and drought warnings in Japan. The results show that EH is significantly influenced by seasonal and regional factors, with its ability to assess drought for wildfire varying
accordingly, whereas SM demonstrates a more consistent ability to assess drought across different seasons and regions. Correlation analysis revealed that atmospheric drought better explains
the drought conditions for wildfire ignition in 11 prefectures, mainly concentrated in the northern regions along the Sea of Japan. In contrast, the correlation coefficients for SM were
higher in 33 prefectures, particularly along the Pacific coast, indicating that soil drought better explains the drought conditions for burned areas in these prefectures. SIMILAR CONTENT
BEING VIEWED BY OTHERS ANALYSIS OF THE SPATIAL AND TEMPORAL EVOLUTION OF DROUGHT IN HENAN BASED ON A NONLINEAR COMPOSITE DROUGHT INDEX Article Open access 26 November 2024 RESPONSE OF
DROUGHT INDEX TO LAND USE TYPES IN THE LOESS PLATEAU OF SHAANXI, CHINA Article Open access 23 May 2022 CASCADING EFFECTS OF DROUGHT IN XILIN GOL TEMPERATE GRASSLAND, CHINA Article Open
access 05 July 2023 Keywords Wildfire characteristics; Soil drought; Atmospheric drought; Humid temperate climate; Japan INTRODUCTION The impacts of wildfires are varied, encompassing
impacts on biodiversity, ecosystem distribution, atmospheric chemistry, and loss of life. The species composition and community structure are influenced by the number of recurrent fires,
with a high fire frequency potentially inhibiting vegetation regeneration1. Frequent wildfires may result in soil degradation and changes in soil salinity2. Wildfires are major producers of
atmospheric trace gases and aerosols, which may have a significant influence on the atmosphere’s radiative balance and pose substantial health hazards3. Moreover, wildfires also result in
economic losses and casualties4. Research suggests that wildfire risks in humid areas are likely to increase, with future climate change potentially exacerbating losses in these regions5,6.
Due to the increase in warm and dry weather caused by climate change, South Korea experienced an unexpected large-scale wildfire in March 2022, burning 22,477 hectares7. This resulted in the
production of large amounts of ultrafine aerosols and an increase in air pollution levels by more than 20 times compared to pre-fire levels. In recent years, multiple wildfire incidents
have occurred in Liangshan Prefecture, Sichuan Province, China. The wildfires in 2019 resulted in 31 deaths, while in 2020, the wildfires burned an area of over 3,000 hectares, causing 19
fatalities8. Therefore, evaluating suitable drought descriptions for humid temperate regions will help to better assess wildfire risk in those areas. Wildfires are complex phenomena
influenced by factors such as climate, weather, topography, vegetation characteristics, and human activities9,10,11. The occurrence of wildfires requires dry fuel and an ignition source.
Human activities and lightning strikes are significant sources of ignition for wildfires. Different types of vegetation exhibit distinct burning characteristics. For instance, shrublands and
grasslands in Mediterranean regions are more prone to wildfires12. Climatic and weather conditions indirectly affect the spread of wildfires by reducing fuel moisture and thus providing
more fuel for wildfires, while strong winds directly affect the rate and direction of fire spread. Topographic factors indirectly affect fire spread by influencing fuel moisture and
distribution, including elevation, slope, and aspect, especially in mountainous areas or areas with complex terrain. Therefore, even within the same region, the main factors affecting the
occurrence and burned area of wildfires may differ. Wildfires in California are more likely to occur under high temperature and high vapor pressure deficit13, but the combination of hot,
dry, and windy weather and dry soil conditions strongly correlates with large wildfire activities14. In Japan, research on wildfires is relatively limited, primarily focusing on prefecture-
or city-level analyses15,16, but the main drought drivers affecting the frequency of wildfires and burned areas across different climatic regions in Japan are not known. On the other hand,
the driving factors of wildfires vary in different climatic regions. In the humid areas of the Inner Mongolia Autonomous Region, China, high annual rainfall results in a higher fuel moisture
content, while high temperatures mainly cause a reduction in fuel moisture in the region, which is considered the leading factor for wildfires17. The specific humidity, vapor pressure, and
Normalized Difference Vegetation Index (NDVI) are the primary driving factors of wildfires in Pakistan18. High temperatures, strong surface winds, and low relative humidity significantly
influence wildfire behavior in Mediterranean climatic regions, including California, southern Europe, Africa, and southern Australia9,19,20. The frequency of wildfires in Siberian larch
forests is strongly correlated with incoming solar radiation21. Japan has a humid climate, which extends from north to south and is influenced by monsoons and ocean currents, leading to
various hydrological conditions. Specifically, the regions along the Sea of Japan are generally humid during winter, especially in the northern areas with abundant snowfall, while summers
are comparatively drier. In contrast, the regions along the Pacific experience relatively dry conditions in winter with lower precipitation levels, while summer is humid and rainy.
Presently, the assessment of nationwide drought and wildfire alerts in Japan is based solely on effective humidity and wind speed. However, considering the link between soil drought and
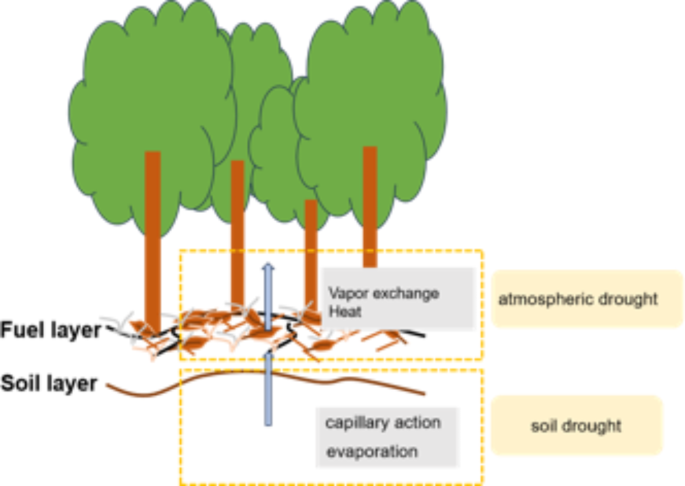
wildfires (Fig. 1), the mechanisms driving drought wildfire in various climatic regions of Japan and the appropriate assessment of drought remain unclear. Fuel resources are abundant and
spatially continuous in humid temperate areas, but the combustibility of fuel is low. In these areas, wildfires are often driven by drought, as drought reduces fuel moisture, affecting fuel
combustibility and thus controlling wildfire activity22. In the Tohoku region of Japan, as a result of low winter rainfall and strong winds, wildfires occurred simultaneously in three
prefectures on the same day in May 2017. The burned area of the wildfire in Kamaishi city, Iwate Prefecture, was larger than the total burned area in Japan in 201623. Therefore,
understanding the mechanisms of fuel moisture content (FMC) variation helps clarify the interrelationship between drought and wildfires in Japan. This study defines atmospheric drought and
soil drought based on the hydrological processes that affect fuel moisture content (Fig. 1). When the vapor pressure on the fuel surface differs from the vapor pressure in the surrounding
air, vapor exchange occurs. High temperatures and low humidity can reduce fuel moisture content by enhancing vapor exchange. A study24 reported that short-term (1–2 weeks) periods of
unusually high temperatures and low atmospheric humidity can lead to rapid fuel drying. Accordingly, the reduction in fuel moisture due to enhanced vapor exchange is defined as atmospheric
drought. Studies have shown that water can be transported from the soil layer to the duff layer by capillary action and evaporation, thereby influencing the fuel moisture content25,26. In
contrast, low soil moisture inhibits capillary action and evaporation, resulting in the drying of surface fuels. The moisture content of dead woody fuel in the Sierra Nevada Mountains is
notably influenced by soil moisture, and the incorporation of soil moisture information can also enhance the spatial heterogeneity of the probability of ignition26. Furthermore, the memory
of soil moisture is closely related to land‒atmosphere feedback processes. Several studies have indicated a correlation between decreased soil moisture and increased wildfire risk, which may
be associated with reduced snowfall and earlier snowmelt27,28. Consequently, drought caused by a reduction in fuel moisture due to soil moisture is defined as soil drought. Wildfires in
humid areas are generally small in Japan, the average area burned by each wildfire from 1995 to 2020 was approximately 0.52 ha29. Remote sensing is an effective tool for wildfire
identification and characterization in a variety of ecosystems, and it is capable of providing wildfire information in areas where wildfire data are lacking17,30. However, it is still
difficult to provide a more accurate wildfire dataset for humid areas using remote sensing technology due to the limitations of remote sensing image quality and spatial/temporal resolution.
Research has shown that wildfires in the Tohoku region of Japan typically do not constitute crown fires, and it is challenging to determine their occurrence and burned area using satellite
data31. Japan produces detailed wildfire reports, which record detailed information on each wildfire since 1995, including the basic burned area, date and time of initiation, and ignition
and firefighting sources. Therefore, this study conducted wildfire analysis in different climatic regions of Japan based on wildfire reports. This research selected the effective humidity
(EH) and soil moisture (SM) from a land surface model as indicators of atmospheric and soil drought. Effective Humidity is calculated based on relative humidity, which represents the ratio
of the actual water vapor content in the air to the maximum water vapor content at a given temperature. EH indirectly reflects the moisture status of the atmosphere. Moreover, EH serves as a
crucial indicator in Japan’s nationwide fire alerts. Despite the country’s diverse and humid climate, EH is extensively utilized in fire weather reports across various prefectures to
evaluate and warn of fire risks. This widespread application underscores EH’s practical utility in assessing both drought and fire risk in Japan. Soil moisture information has significant
potential for understanding, assessing, and predicting wildfire risks. For example, a week before the Camp Fire in California, NASA’s SMAP satellite observations revealed abnormally low soil
moisture levels in northern California32. In the Australian fire danger rating system, the Keetch–Byram Drought Index (KBDI) is utilized to assess the fire risk in dry eucalyptus forests.
The KBDI measures the moisture deficit in organic and mineral soil layers by estimating the net effect of precipitation and evapotranspiration, but it does not account for factors such as
wind speed, radiation, vegetation, and soil properties. Process-based models simulate soil moisture by accounting for complex hydrological processes, including climate, topography, and
vegetation effects, while also overcoming the limitations of insufficient historical in situ and satellite measurements of soil moisture. Consequently, this study conducted a statistical
analysis of wildfire incidence rates in different prefectures of Japan within varying EH and SM threshold ranges. Due to climate and vegetation variations across regions, wildfires exhibit
distinct temporal characteristics in Japan: wildfires mainly occur in spring. In this research, the fire season was defined based on the number of wildfires. Then, an assessment of suitable
drought descriptions for different prefectures was conducted by evaluating the correlation between wildfire (occurrence/burned area) and drought indices (SM/EH) during the wildfire season.
This study aimed to (1) elucidate the seasonal and spatial characteristics of the interrelationships between soil drought/atmospheric drought and the occurrence of wildfires, (2) evaluate
the ability of effective humidity to explain drought (for which a fire warning system for Japanese fire alarms was used), (3) and assess the primary drought-driven type influencing the
wildfire frequency and burned area in different regions of Japan during the wildfire season. In summary, this study provides new insights into wildfire risk assessment in Japan while also
serving as a reference for exploring the drought-driven factors of wildfires in humid temperate climatic regions. RESULTS STATISTICAL ANALYSIS OF WILDFIRE OCCURRENCE BASED ON EH AND SM
THRESHOLDS The incidence of wildfires within different EH and SM thresholds was calculated for different seasons in each prefecture in Japan. The seasons are defined as follows: spring
corresponds to the months of March, April, and May; summer corresponds to June, July, and August; autumn corresponds to September, October, and November; and winter corresponds to December,
January, and February. The results indicated that EH conditions for wildfire occurrence exhibited distinct seasonal variations across prefectures. Some prefectures had relatively small
differences in EH conditions for wildfire occurrence, such as Hokkaido (PC1) and Niigata (PC15) (Fig. 2a, b). In this study, \(\:{T}_{EH}^{80}/{T}_{SM}^{80}\) is defined as the EH/SM
threshold at which 80% of the fires occur within a season in the prefecture. In addition, \(\:{{D}_{EH}^{80}/D}_{SM}^{80}\) is defined as the proportion of days within a given season where
the EH/SM falls below the defined threshold. Most wildfires in Hokkaido occurred at EH values of 70–80%, with \(\:{T}_{EH}^{80}\:\)being less than 74% in spring, 82% in summer, 77% in fall,
and 80% in winter. The \(\:{T}_{EH}^{80}\) in Niigata Prefecture was 68% in spring, 76% in summer, 74% in fall, and 76% in winter. In contrast, in some prefectures, there was a large
variation in the EH conditions under which wildfires occurred in different seasons, such as in Chiba (PC12) and Shizuoka Prefectures (PC22) (Fig. 2c, d). In Chiba and Shizuoka Prefectures,
most of the wildfires occurred at EH values below 60% in winter, 60–70% in spring, and 70–80% in summer and fall. Compared with the results for EH, the seasonal variations in the wildfire
incidence rate within the different SM thresholds were relatively small (Fig. 2e, f, g, h). In Hokkaido and the Niigata and Shizuoka Prefectures, wildfires were mostly concentrated within an
SM of 0.7–0.8, regardless of season. In Chiba Prefecture, the frequency of wildfires was greater at SM values less than 0.7. To assess the spatial characteristics of seasonal variations in
Japan, the EH and SM thresholds were calculated for 80% of the wildfire incidence in each prefecture for each season. In addition, the proportion of days below the corresponding EH threshold
and SM threshold were calculated for each season (Fig. 3 and Fig. 4). There were significant spatial differences in winter \(\:{T}_{EH}^{80}\), with higher \(\:{T}_{EH}^{80}\) in the
northern part of Japan, mainly along the Sea of Japan. In the Tohoku and Chugoku regions along the Sea of Japan, \(\:{D}_{EH}^{80}\) was mostly less than 0.4, and the results indicated that
even though the majority of the wildfires occurred under high EH conditions, they still occurred during the relatively low EH period of the season. However, in other areas, especially in
fire-prone areas (Hiroshima (PC34), Okayama (PC33), and Hyogo Prefectures (PC28)), high \(\:{T}_{EH}^{80}\) and high \(\:{D}_{EH}^{80}\) suggest that EH had less influence on wildfire
occurrence in these areas during the winter. In spring, \(\:{T}_{EH}^{80}\) was relatively high in northern Japan. However, in Hokkaido and the Tohoku and Chugoku regions along the Sea of
Japan, despite the relatively high \(\:{T}_{EH}^{80}\), it corresponded to a lower EH period of the spring, with \(\:{D}_{EH}^{80}\) around 0.4. Across all prefectures of Japan,
\(\:{T}_{EH}^{80}\) was higher in the summer and fall. However, during the summer, although most prefectures experienced wildfires under high EH conditions, the majority of these wildfires
still occurred during periods when EH was relatively low, with \(\:{D}_{EH}^{80}\) generally below 0.5. Figure 4 shows that although the seasonal differences in \(\:{T}_{SM}^{80}\) were
relatively small, there were still significant spatial differences. In winter, a higher \(\:{T}_{SM}^{80}\) in northern Japan indicated that most wildfires occurred under high SM conditions,
especially in the coastal region of the Sea of Japan. In the Tohoku and Chubu regions along the Sea of Japan, \(\:{D}_{SM}^{80}\) was greater than 0.7, which indicated that SM did not
affect wildfire occurrence in these regions. In contrast, in the southern region of Japan (including Hiroshima, Okayama, and Hyogo Prefectures), the \(\:{T}_{SM}^{80}\) values were lower,
and the \(\:{D}_{SM}^{80}\) values were also lower. The spatial distribution of \(\:{T}_{SM}^{80}\) in fall is similar to that in winter, with a higher \(\:{T}_{SM}^{80}\) in the northern
part of the prefecture; however, most prefectures in Japan had a smaller \(\:{D}_{SM}^{80}\). The spatial distribution of \(\:{T}_{SM}^{80}\) was similar in spring and summer, with higher
\(\:{T}_{SM}^{80}\) values in the Chubu region, the western part of the Tohoku region, the southern part of the Kinki region, and the northern part of the Kyushu region. However,
\(\:{D}_{SM}^{80}\) was small in all prefectures, ranging from 0.27 to 0.54 in spring and 0.22 to 0.62 in summer, and less than 0.4 in most prefectures, suggesting that most of the wildfires
occurred in the relatively low SM period of spring and summer, including in the northern part of Hokkaido and the coastal region of the Sea of Japan. Figure 5 shows the frequency
distributions of \(\:{T}_{EH}^{80}\) and \(\:{T}_{SM}^{80}\) for all prefectures of Japan in each season, along with \(\:{D}_{EH}^{80}\) and \(\:{D}_{SM}^{80}\). Figure 5 (a) shows that
\(\:{T}_{EH}^{80}\) was concentrated in a range of 60–70% in the spring and 70–80% in the fall and mostly exceeded 75% in the summer. However, dispersed \(\:{T}_{EH}^{80}\) values in winter
indicate significant regional differences. As shown in Fig. 5 (b), \(\:{T}_{SM}^{80}\) throughout the year was concentrated between 0.7 and 0.75. The results in Fig. 5 (c) show that in
spring and summer, \(\:{D}_{EH}^{80}\) was relatively low, mainly in a range of 0.3–0.5, indicating that the majority of wildfires occurred during relatively low SM periods. In contrast,
during the winter and fall, the \(\:{D}_{EH}^{80}\) was relatively high, mainly between 0.5 and 0.7. Figure 5 (d) shows that in all seasons except winter, most prefectures had a lower
\(\:{D}_{SM}^{80}\), suggesting that most wildfires occurred during periods of soil drought in these seasons. In summer, the \(\:{D}_{SM}^{80}\) values were mainly concentrated in a range of
0.2–0.4 in all prefectures, whereas they were in a range of 0.3–0.5 in spring and fall and in a range of 0.5–0.6 in winter. SPATIAL PATTERNS OF THE WILDFIRE-DROUGHT INDEX (DI) CORRELATIONS
DURING THE WILDFIRE SEASON Wildfires in Japan exhibit significant seasonal impacts, and to explore the main drought drivers of wildfires in different regions, we subsequently focused on the
wildfire season. We first computed the annual EH and SM distributions for each day during the wildfire season in every prefecture (Fig. 6), with different colors representing different
regions of Japan. As shown in Fig. 6(a), the EH values during the wildfire season in the southern parts of the Kanto and Chubu regions were relatively low, mostly below 60%. In contrast, the
EH values during the wildfire season in Hokkaido, Tohoku, along the coast of the Sea of Japan in the Chubu region, and in Okinawa were greater than 70%. According to the SM results (Fig.
6b), prefectures with exceptionally low soil moisture were mainly located in the southern part of the Chugoku region and the northern part of the Shikoku region, mostly below 0.7. The soil
moisture in the prefectures along the coast of the Sea of Japan in the Tohoku and Chubu regions was relatively high. Additionally, most prefectures in the Kanto region exhibited low soil
moisture, typically around 0.7. To evaluate the suitability of drought descriptions, this analysis utilized Pearson correlation to examine the relationships between wildfire and drought
indices (SM and EH). Since the SM obtained from the SiBUC is hourly and EH is a daily index, the monthly drought index is derived by averaging the lowest 20% values of SM and EH within each
month, serving as a representative measure of drought intensity for that month. Given that the majority of burned areas were small and that the raw data distribution was nonnormal, the
logarithm of the monthly total burned area (BA) was used in this study. Additionally, months with a total BA of 0 were excluded from the calculations. Figure 7 shows the Pearson correlation
coefficient between the monthly total number of wildfires (NO)/the logarithm of the monthly total burned area and drought indices for each prefecture in Japan. The white color in Fig. 7
indicates that the corresponding EH/SM results for the prefecture had a significance level greater than 0.05, while other colors indicate results with a significance level less than 0.05.
The Pearson correlation coefficient measures the degree of correlation (linear correlation) between two variables, and its value is between − 1 and 1. A larger absolute value indicates a
stronger correlation between two variables. A notably strong correlation with EH was observed in the northern region of Japan, particularly along the coast of the Sea of Japan. The
correlation coefficient ranged from 0.5 to 0.75 in the Hokkaido and Tohoku regions. Conversely, a strong correlation with SM was identified along the Pacific coast Fig. 7 (b), with
correlation coefficients exceeding 0.65 in fire-prone prefectures such as Chiba, Fukushima, Hyogo, Hiroshima, and Okayama. A comparison of the correlation coefficients between SM and EH for
each prefecture is shown in Fig. 7 (c), where green indicates a stronger correlation between SM and the number of wildfires and red indicates a stronger correlation between EH and the number
of wildfires. Among the 11 prefectures, EH exhibited a greater correlation with NO, which was primarily concentrated in the northern regions along the coast of the Sea of Japan, while in
the remaining 36 prefectures, SM demonstrated a stronger correlation with NO. The EH results showed a linear correlation with the burned areas in 32 prefectures, with correlation
coefficients ranging from 0.28 to 0.68 (Fig. 7d). Strong correlations were mainly observed in the Hokkaido region and the Tohoku region. In comparison, the SM results revealed correlations
with burned areas across 39 prefectures, with correlation coefficients ranging from 0.28 to 0.67 (Fig. 7e). Regions with higher correlations were predominantly concentrated on the Pacific
coast, where the burned area was also large. A comparison of the SM and EH results (Fig. 7f) revealed that EH had a stronger correlation with the burned areas in 12 prefectures, while SM had
a stronger correlation with the burned areas in the remaining 33 prefectures. Particularly in the Hokkaido region and the northern part of Japan along the Sea of Japan, EH exhibited
stronger correlations with both the number of wildfires and the burned area than SM. However, both the number of wildfires and the burned area were smaller in this region. DISCUSSION This
study defined atmospheric drought and soil drought based on hydrological fuel moisture changes. Using EH and SM as indicators of atmospheric and soil drought, respectively, we analyzed the
temporal and spatial characteristics of their relationships with wildfires. Furthermore, the suitability of drought descriptions under various humid climatic regions in Japan was evaluated.
The main results of the study are summarized as follows: * Through an analysis of \(\:{T}_{EH}^{80}\) and \(\:{T}_{SM}^{80}\) in all prefectures in all seasons (Fig. 3 and Fig. 4), this
study revealed that the ability of EH to assess drought was significantly influenced by both seasonality and regional variation, whereas the assessment ability of SM was less affected by
these factors. Each prefecture in Japan uses different EH thresholds for wildfire warnings, but these thresholds are all below 65%. However, the results of this study indicate that these
thresholds are only applicable in certain seasons within certain prefectures. For example, in Hokkaido and Niigata, wildfires almost never occur when EH is below 65%, whereas in Chiba
Prefecture, most wildfires occur when EH is below 65% in spring and winter, but in summer and autumn, most wildfires occur when EH is above 65%. The results indicated that the EH had a
relatively strong ability to assess drought in Japan during the spring, especially in the Tohoku and Chugoku regions along the Sea of Japan, where \(\:{T}_{EH}^{80}\) was relatively low, and
\(\:{D}_{EH}^{80}\) was also approximately 0.4. Spring was the driest season in Japan with the most wildfires. Spring wildfires in Japan have been found to be related to insolation33,
increased spring insolation and water vapor exchange, resulting in a decrease in fuel moisture. On the other hand, at the regional scale, precipitation is an important meteorological forcing
affecting variations in soil moisture content34. In spring, reduced rainfall and increased temperatures across various regions led to a decrease in soil moisture, thereby inhibiting the
replenishment from soil moisture to fuel moisture and enhancing fuel combustibility. Consequently, SM was also able to better reflect drought conditions during the spring season. During the
summer and fall, wildfires also occurred more often during periods of soil drought, although SM thresholds increased in some prefectures. Northern Japan experiences cold and wet conditions
in winter, particularly in the Tohoku and Chugoku regions along the Sea of Japan, where heavy snowfall is common. The snow cover and increased precipitation help maintain high soil moisture
levels, making it challenging for SM to indicate drought conditions, with a high \(\:{D}_{SM}^{80}\) mostly exceeding 0.7. * The results of the correlation analysis between EH/SM and the
number of wildfires in the wildfire season show that EH can better explain the drought conditions for wildfire ignition in 11 prefectures, which are mainly concentrated in the northern area
along the coast of the Sea of Japan (Fig. 7). Wildfire activity is sensitive to spring snowmelt35,36,37. In Hokkaido and the northern area on the coast of the Sea of Japan, the land surface
is extensively covered with snow during winter. Snowmelt serves as a crucial water source during spring. Both the snowmelt and lower temperatures are important factors in delaying the onset
of the wildfire season in these regions. Figure 8 presents the monthly variations in effective humidity and soil moisture for Akita (PC5), Toyama (PC16), Kochi (PC39), and Chiba (PC12)
Prefectures, which are representative of regions with later and earlier wildfire seasons, respectively. The left panel illustrates the monthly trends in effective humidity across these four
prefectures, while the right panel depicts the corresponding variations in soil moisture. In regions with later wildfire seasons, such as Akita and Toyama, both soil moisture and effective
humidity remain relatively high during the spring, likely influenced by increased moisture from spring snowmelt. These elevated moisture levels may delay fuel drying, thereby postponing the
onset of the wildfire season. Conversely, in regions with earlier wildfire seasons, such as Kochi and Chiba, the absence of significant snow accumulation during the warmer winter months
results in lower soil moisture and effective humidity during the spring. In the northern areas along the Sea of Japan, soil moisture increases after snowmelt38, resulting in relatively high
soil moisture at the beginning of the wildfire season. Despite a decline in soil moisture during drought periods, it remains at relatively high levels. Consequently, wildfires are more
likely to occur when effective humidity decreases to drier conditions. In other regions, especially along the Pacific coast, SM better explains the drought conditions for the ignition of
wildfires. Low rainfall during winter leads to dry surface soil before the wildfire season, and the subsequent decrease in SM during the wildfire season further significantly increases the
combustibility of fuel. * The results of the correlation analysis between EH, SM and burned area in the wildfire season were similar to the results for NO. The correlation coefficient of SM
was greater in 33 prefectures, indicating that SM better explained the drought conditions for burned areas in these prefectures. Substantial antecedent rainfall promotes SM and plant growth,
generating abundant fuel, while low rainfall during the wildfire season dries out fuel, leading to an increase in the frequency of large-scale fires39,40. In the northern region of Kyushu,
abundant rainfall during the rainy season likely results in the accumulation of fuel. During the wildfire season, low EH significantly reduces the FMC, thereby leading to larger-scale
burning. On the other hand, in the southern Chugoku region and the northern Shikoku region, the annual rainfall is noticeably lower than the national average. While the rainy season promotes
fuel accumulation, the overall decrease in rainfall leads to the early onset of soil drought. Consequently, during the wildfire season, significantly reduced soil moisture greatly increases
the availability and combustibility of fuel, thereby facilitating the spread of wildfires. Although Japan’s wildfire alert system relies only on EH and wind for wildfire predictions, the
results indicate that EH is significantly influenced by both seasonal and regional factors, which affects its ability to assess drought conditions for wildfires. In contrast, SM demonstrates
a more consistent ability to assess drought across different seasons and regions. This study contributes to a better understanding of the mechanisms underlying wildfire occurrence and
development in Japan, thereby supporting the formulation of effective wildfire management strategies. Additionally, this study can provide valuable insights for assessing drought in humid
regions in the future. Nevertheless, this study is subject to certain limitations. Although studies have shown that the number and burned area of wildfires in various regions of Japan are
closely related to atmospheric/soil drought, we only examined EH for atmospheric drought. However, factors such as strong winds and high radiation also significantly affect the availability
of fuel. Studies have found that wind was the major driver of the 2020 megafires in the North American Pacific Northwest41. The frequency of wildfires in Siberian larch forests was strongly
correlated with incoming solar radiation21. Additionally, human activities also play a significant role in wildfire activities, primarily affecting wildfire activity through increased
ignition, fire management, and land cover42,43. The occurrence of wildfires in Alaska is related to the distance from human habitation areas, with the probability of wildfires decreasing as
the distance from roads increases44. Wildfire risk at the wildland–urban interface (WUI) continues to increase as human settlements expand into fire-prone areas (forested areas)45. Most
wildfires in Japan are caused by human activities; therefore, future research that comprehensively considers both human factors and climatic impacts on wildfires will help in predicting and
managing wildfires. Most of the fuel ignited during wildfires in Japan consists of dead plant material29. The fuel moisture of dead fuel can respond to short-term (hours to days) dry
atmospheric conditions46,47, but this study is based on monthly scale analysis and cannot effectively capture short-term changes in fuel moisture content. Additionally, topography, climate,
and vegetation influence the spatial distribution patterns of fuels7,48,49. Therefore, future work should include detailed fuel moisture content analysis and comprehensively consider the
impact of the temporal and spatial distribution patterns of fuel on wildfires. MATERIALS AND METHODOLOGY STUDY AREA Japan was selected as the targeted area of this study (Fig. 9), where PC
represents the prefecture code shown in the figure below. Japan has 37.8 million hectares of land and 25.5 million hectares of forest, and approximately two-thirds (66%) of the land area in
Japan is forest. Most of Japan falls within the temperate climate zone and experiences four distinct seasons, with notable variations between summer and winter. In Hokkaido, winters are
characterized by a prolonged and cold climate, while summers are cool, notably without a rainy season. The average annual temperature in Japan is approximately 15 °C. Okinawa Prefecture
boasts the highest average temperature, reaching approximately 23 °C, while Hokkaido experiences the lowest average temperature, at approximately 9 °C. Climatic disparities are influenced
not only by latitude but also by the presence of mountains in the central part of the Japanese archipelago, resulting in significant variations between the Pacific Ocean and Sea of Japan
coasts. On the Pacific coast, summers are hot, and winters are relatively dry. On the Sea of Japan coast, winters are humid with substantial snowfall, especially in the western Tohoku and
northern Chubu regions, while summers tend to be dry and hot. Southern Chugoku, northern Shikoku, western Kinki, and northern Kyushu, which are sheltered by the Shikoku Mountains in summer
and the Chugoku Mountains in winter, exhibit a stable and warm climate with low annual rainfall. In the Kyushu and Okinawa regions, summers are hot, winters are mild, and annual rainfall is
high, particularly during the summer rainy season and typhoon season. WILDFIRE IN JAPAN The fire reports in Japan, documenting detailed surveys of all fires since 1995, are consolidated and
managed by the Fire and Disaster Management Agency (FDMA). This dataset contains detailed information about each wildfire, such as fire location, burned area, cause of ignition, and date and
time of initiation. A total of 45,070 wildfires occurred in Japan during 1995–2012, with a total burned area of 241.06 km2. This study focused on all of Japan as the study area, and Fig. 10
shows the temporal–spatial characteristics of wildfires in Japan from 1995 to 2012. The number and burned area of wildfires in Japan showed a declining trend. The number of wildfires in
2012 was approximately 40% of that in 1995, while the burned area was only approximately 20% of the 1995 level (Fig. 10a). Figure 10 (b) illustrates the total number of wildfires and burned
area per month in Japan, and Fig. 10 (c, d, e) shows the spatial characteristics of wildfires in each prefecture from 1995 to 2012. Based on the average value in 2015–2019, Japan experienced
more than 1200 wildfires annually, with a yearly burned area exceeding 700 hectares. Both the number and burned area of wildfires in Japan had similar seasonal variations, with wildfires
predominantly occurring during the spring and the period from winter to the rainy season. During these times, there was also a significant extent of burned area. Figure 10(c, d) shows the
spatial variations in the number and burned area of wildfires across different prefectures. Regions with a higher incidence of wildfires and a more substantial burned area were predominantly
located along the Pacific coast, particularly in the southern part of the Chugoku region. On average, more than 100 incidents occurred annually, with burned areas exceeding 60 hectares. The
Chugoku region experiences less annual rainfall and is below the national average50. The eastern regions of Kanto and Tohoku experienced a greater frequency of wildfires, but these
incidents tended to result in smaller burned areas. In contrast, the northern part of the Kyushu and Hokkaido regions exhibited larger burned areas despite a lower incidence of wildfires.
Figure 10(e) shows the starting date of the wildfire season in 47 prefectures. Due to the seasonal characteristics of wildfires in Japan, the fire season was defined in this study as the
period comprising 90 consecutive days with the greatest number of wildfires29. The wildfire season in the northern region starts later than that in the southern region, and the most recent
place where the wildfire season starts is Hokkaido, which is around late March. Snowmelt provides water in spring and summer, while heavy snowfall in the northern Chubu region and western
Tohoku region is crucial for delaying the wildfire season. EFFECTIVE HUMIDITY Low humidity makes fuel drier and flammable. In Japan, effective humidity, minimum humidity and wind speed are
used as fire warning criteria. Previous studies have indicated that effective humidity could be utilized as a predictive factor for wildfires in Japan16. The effective humidity accounts for
the history of humidity over previous days. It is an index showing the degree of dryness of wood. It is given by the following equation: $$\:{H}_{e}=(1-r)({H}_{0}+r{H}_{1}+{r}^{2}{H}_{2})$$
(1) where \(\:{H}_{e}\) is the effective humidity and \(\:{H}_{0}\), \(\:{H}_{1}\), and \(\:{H}_{2}\) are the relative humidities within 3 days. _r_ is generally set to 0.7. The relative
humidity was calculated using the air temperature and dew point temperature from Dynamical Regional Downscaling Using the JRA-55 Reanalysis dataset (DSJRA-55) at a 0.5°×0.5° resolution from
1995 to 201251. SOIL MOISTURE FROM THE LAND SURFACE MODEL The soil moisture from the simple biosphere including urban canopy (SiBUC) model was used in this study52. The SiBUC is based on
physical processes, and it has three layers of soil considering the effects of deep-water supply and root transpiration. Furthermore, SiBUC adopts a single-layer snow model, allowing for the
consideration of snowmelt in the water supply conditions during spring. The surface soil moisture simulated by SiBUC demonstrated good accuracy compared to the validated measured surface
soil moisture53. In this study, we focused on the soil moisture content of the first layer, as it directly influences the moisture content and combustion of dead fuel. Soil moisture analysis
by SiBUC could be an indicator of the dry condition of the soil in the Tohoku region of Japan54. The unsaturated permeability of the soil is calculated according to the saturation of each
soil layer. When it is converted into volumetric water content, the accuracy of soil parameters such as porosity has a great influence; therefore, the saturation rate is directly used for
evaluation. The analysis using the SiBUC model was performed at 5 km and 1-hour resolutions in Japan from 1995 to 2012. The land-use data were created based on the digital national land
information of Japan, with forest classification conducted using the GLCC55. Additionally, the vegetation index and soil conditions were determined using ECOCLIMAP-II data56. The
precipitation data were obtained from the Asian Precipitation Highly Resolved Observational Data_Japan (APHRO_JP)57,58, while other forcing data, such as temperature, downward shortwave
radiation, downward longwave radiation, and wind velocity, were sourced from the DSJRA-55 dataset. DATA AVAILABILITY The wildfire data that support the findings of this study are available
from the Fire and Disaster Management Agency (Japan) but restrictions apply to the availability of these data, which were used under license for the current study, and so are not publicly
available. The authors do not have permission to share the wildfire data. Other datasets utilized to perform this study are freely available on the internet. For further information, please
contact the corresponding author. The specific data sources are as follows: DSJRA-55 dataset: https://jra.kishou.go.jp/DSJRA-55/index_en.html. APHRO_JP:
https://search.diasjp.net/ja/dataset/APHRO_JP. REFERENCES * Tessler, N., Sapir, Y., Wittenberg, L. & Greenbaum, N. Recovery of Mediterranean Vegetation after recurrent forest fires:
insight from the 2010 Forest Fire on Mount Carmel, Israel. _Land. Degrad. Dev. _27, 1424–1431 (2016). Article Google Scholar * Caon, L., Vallejo, V. R., Ritsema, C. J. & Geissen, V.
Effects of wildfire on soil nutrients in Mediterranean ecosystems. _Earth-Sci. Rev. _139, 47–58 (2014). Article ADS CAS Google Scholar * Rappold, A. G., Reyes, J., Pouliot, G. &
Cascio, W. E. Diaz-Sanchez, D. Community vulnerability to Health impacts of Wildland Fire smoke exposure. _Environ. Sci. Technol. _51, 6674–6682 (2017). Article ADS CAS PubMed PubMed
Central Google Scholar * Johnston, D. W., Önder, Y. K., Rahman, M. H. & Ulubaşoğlu, M. A. Evaluating wildfire exposure: using wellbeing data to estimate and value the impacts of
wildfire. _J. Econ. Behav. Organ. _192, 782–798 (2021). Article Google Scholar * Peng, X. et al. Projections of wildfire risk and activities under 1.5°C and 2.0°C global warming scenarios.
_Environ. Res. Commun. _5, 031002 (2023). Article Google Scholar * Gannon, C. S. & Steinberg, N. C. A global assessment of wildfire potential under climate change utilizing
Keetch-Byram drought index and land cover classifications. _Environ. Res. Commun. _3, 035002 (2021). Article Google Scholar * Chang, D. Y. et al. Unprecedented wildfires in Korea:
historical evidence of increasing wildfire activity due to climate change. _Agric. Meteorol. _348, 109920 (2024). Article Google Scholar * Feng, H. Exploration and Thinking on Related
Mechanisms of Forest Fire Prevention. In Proceedings of the 2021 International Conference on Social Science: Public Administration, _Law and International Relations (SSPALIR_ ; Atlantis
Press, 13–18(2021). (2021). * Grillakis, M. et al. Climate drivers of global wildfire burned area. _Environ. Res. Lett. _17, 045021 (2022). Article ADS Google Scholar * Holsinger, L.,
Parks, S. A. & Miller, C. Weather, fuels, and topography impede wildland fire spread in western US landscapes. _Ecol. Manag_. 380, 59–69 (2016). Article Google Scholar * Chen, B. et
al. Climate, fuel, and Land Use shaped the spatial pattern of Wildfire in California’s Sierra Nevada. _J. Geophys. Res. Biogeosciences_. 126, e2020JG005786 (2021). Article ADS Google
Scholar * Rego, F. C. & Silva, J. S. Wildfires and landscape dynamics in Portugal: a regional assessment and global implications. In _Forest Landscapes and Global Change: Challenges for
Research and Management_, 51–73 (2014). Chapter Google Scholar * Li, S. & Banerjee, T. Spatial and temporal pattern of wildfires in California from 2000 to 2019. _Sci. Rep. _11, 8779
(2021). Article ADS CAS PubMed PubMed Central Google Scholar * Hiraga, Y. & Kavvas, M. L. Hydrological and Meteorological controls on large wildfire ignition and burned area in
Northern California during 2017–2020. _Fire_. 4, 90 (2021). Article Google Scholar * Satoh, K. et al. A System to Predict Occurrence and Development of Forest Fires–Computer Simulation of
Forest Fires Based on Weather Data. In _Proceedings of the Thermal Engineering Conference_, Tokyo, Japan, 7–8 (2002). * Sano, T. & Sato, Y. Prediction of the forest fire occurrence
danger rate by population density, vegetation, and meteorological elements in Hiroshima prefecture. _Bull. Hiroshima Prefect Res. Cent. _38, 9–24 (2006). Google Scholar * Sun, H. et al. The
relative importance of driving factors of wildfire occurrence across climatic gradients in the Inner Mongolia, China. _Ecol. Indic. _131, 108249 (2021). Article Google Scholar * Rafaqat,
W., Iqbal, M., Kanwal, R. & Song, W. Study of driving factors using machine learning to Determine the Effect of Topography, Climate, and fuel on Wildfire in Pakistan. _Remote Sens. _14,
1918 (2022). Article ADS Google Scholar * Goss, M. et al. Climate change is increasing the likelihood of extreme autumn wildfire conditions across California. _Environ. Res. Lett. _15,
094016 (2020). Article ADS Google Scholar * Lagouvardos, K., Kotroni, V., Giannaros, T. M. & Dafis, S. Meteorological conditions Conducive to the Rapid Spread of the Deadly Wildfire
in Eastern Attica, Greece. _Bull. Am. Meteorol. Soc. _100, 2137–2145 (2019). Article ADS Google Scholar * Ponomarev, E. I., Kharuk, V. I. & Ranson, K. J. Wildfires dynamics in
siberian larch forests. _Forests_. 7, 125 (2016). Article Google Scholar * Pausas, J. G. & Paula, S. Fuel shapes the fire–climate relationship: evidence from Mediterranean ecosystems.
_Glob Ecol. Biogeogr. _21, 1074–1082 (2012). Article Google Scholar * Touge, Y., Hasegawa, M., Minegishi, M., Kawagoe, S. & Kazama, S. Multitemporal UAV surveys of geomorphological
changes caused by postfire heavy rain in Kamaishi city, Northeast Japan. _CATENA_. 220, 106702 (2023). Article Google Scholar * McEvoy, D. J. et al. Establishing relationships between
Drought indices and Wildfire Danger outputs: a Test Case for the California-Nevada Drought early warning system. _Climate_. 7, 52 (2019). Article Google Scholar * Matthews, S. Dead fuel
moisture research: 1991–2012. _Int. J. Wildland Fire_. 23, 78 (2014). Article Google Scholar * Rakhmatulina, E., Stephens, S. & Thompson, S. Soil moisture influences on Sierra Nevada
dead fuel moisture content and fire risks. _Ecol. Manag_. 496, 119379 (2021). Article Google Scholar * Medler, M. J., Montesano, P. & Robinson, D. Examining the relationship between
snowfall and wildfire patterns in the Western United States. _Phys. Geogr. _23, 335–342 (2002). Article Google Scholar * Westerling, A. L., Hidalgo, H. G., Cayan, D. R. & Swetnam, T.
W. Warming and earlier spring increase western U.S. forest wildfire activity. _Science_. 313, 940–943 (2006). Article ADS CAS PubMed Google Scholar * Touge, Y., Shi, K., Nishino, T.,
Sun, C. & Sekizawa, A. Spatial-temporal characteristics of more than 50,000 wildfires in Japan from 1995 to 2020. _Fire Saf. J. _142, 104025 (2024). Article Google Scholar * Levin, N.,
Tessler, N., Smith, A. & McAlpine, C. The human and physical determinants of wildfires and burnt areas in Israel. _Environ. Manage. _58, 549–562 (2016). Article ADS PubMed Google
Scholar * Emang, G. P., Touge, Y. & Kazama, S. Evaluation of historical wildfires in Tohoku Region using Satellite-based high-fire-severity index. _J. Disaster Res. _17, 507–515 (2022).
Article Google Scholar * Krueger, E. S. et al. Using soil moisture information to better understand and predict wildfire danger: a review of recent developments and outstanding questions.
_Int. J. Wildland Fire_. 32, 111–132 (2022). Article Google Scholar * Inoue, J., Okuyama, C. & Takemura, K. Long-term fire activity under the east Asian monsoon responding to spring
insolation, vegetation type, global climate, and human impact inferred from charcoal records in Lake Biwa sediments in central Japan. _Quat Sci. Rev. _179, 59–68 (2018). Article ADS Google
Scholar * Crow, W. T. et al. Upscaling sparse ground-based soil moisture observations for the validation of coarse-resolution satellite soil moisture products. _Rev. Geophys. _50, (2012).
* Westerling, A. L. Increasing western US forest wildfire activity: sensitivity to changes in the timing of spring. _Philos. Trans. R Soc. B Biol. Sci. _371, 20150178 (2016). Article Google
Scholar * O’Leary, D. S., Bloom, T. D., Smith, J. C., Zemp, C. R. & Medler, M. J. A New Method comparing snowmelt timing with Annual Area burned. _Fire Ecol. _12, 41–51 (2016). Article
Google Scholar * Holden, Z. A., Morgan, P., Crimmins, M. A., Steinhorst, R. K. & Smith, A. M. S. Fire season precipitation variability influences fire extent and severity in a large
southwestern wilderness area, United States. _Geophys. Res. Lett. _34, (2007). * Brandt, A. C., Zhang, Q., Caceres, M. L. L. & Murayama, H. Soil temperature and soil moisture dynamics in
winter and spring under heavy snowfall conditions in North-Eastern Japan. _Hydrol. Process. _34, 3235–3251 (2020). Article ADS Google Scholar * Jensen, D. et al. The sensitivity of US
wildfire occurrence to pre-season soil moisture conditions across ecosystems. _Environ. Res. Lett. _13, 014021 (2018). Article ADS PubMed PubMed Central Google Scholar * Hernández
Ayala, J. J., Mann, J. & Grosvenor, E. Antecedent Rainfall, Excessive Vegetation Growth and Its Relation to Wildfire Burned Areas in California. _Earth Space Sci._ 8, eEA001624 (2021).
(2020). * Evers, C., Holz, A., Busby, S. & Nielsen-Pincus, M. Extreme winds Alter influence of fuels and topography on Megafire burn severity in Seasonal Temperate rainforests under
Record Fuel Aridity. _Fire_. 5, 41 (2022). Article Google Scholar * Mann, M. L. et al. Incorporating anthropogenic influences into Fire Probability models: effects of Human Activity and
Climate Change on Fire Activity in California. _PLOS ONE_. 11, e0153589 (2016). Article PubMed PubMed Central Google Scholar * Bowman, D. M. J. S. et al. The human dimension of fire
regimes on Earth. _J. Biogeogr. _38, 2223–2236 (2011). Article PubMed PubMed Central Google Scholar * Calef, M. P., McGuire, A. D. & Chapin, F. S. Human influences on Wildfire in
Alaska from 1988 through 2005: an analysis of the spatial patterns of human impacts. _Earth Interact. _12, 1–17 (2008). Article ADS Google Scholar * Radeloff, V. C. et al. Rapid growth of
the US wildland-urban interface raises wildfire risk. _Proc. Natl. Acad. Sci._ 115, 3314–3319 (2018). * Hiers, J. K. et al. Fine dead fuel moisture shows complex lagged responses to
environmental conditions in a saw palmetto (Serenoa repens) flatwoods. _Agric. Meteorol. _266–267, 20–28 (2019). Article Google Scholar * Nyman, P., Baillie, C. C., Duff, T. J. &
Sheridan, G. J. Eco-hydrological controls on microclimate and surface fuel evaporation in complex terrain. _Agric. Meteorol. _252, 49–61 (2018). Article Google Scholar * Schoennagel, T.,
Veblen, T. T. & Romme, W. H. The Interaction of Fire, Fuels, and Climate across Rocky Mountain Forests. _BioScience_ 54, 661–676 (2004). * Schwartz, M. W. et al. Increasing elevation of
fire in the Sierra Nevada and implications for forest change. _Ecosphere_. 6, art121 (2015). Article Google Scholar * Yue, S. & Hashino, M. Long Term trends of Annual and Monthly
Precipitation in Japan1. _JAWRA J. Am. Water Resour. Assoc. _39, 587–596 (2003). Article ADS Google Scholar * Kayaba, N. et al. Dynamical Regional Downscaling using the JRA-55 reanalysis
(DSJRA-55). _Sola_. 12, 1–5 (2016). Article ADS Google Scholar * Tanaka, K. Development of the new land surface scheme SiBUC commonly applicable to basin water management and numerical
weather prediction model. Doctoral Dissertation. Graduate School of Engineering, Kyoto University; 289 (2004). * Shi, K., Touge, Y. & Kazama, S. Defining Homogeneous Drought zones based
on Soil moisture across Japan and Teleconnections with large-scale climate signals. _J. Appl. Meteorol. Climatol_. 61, 43–60 (2022). Article ADS Google Scholar * Touge, Y., Emang, G. P.
& Kazama, S. Evaluation of Soil Moisture Dryness Using Land Surface Model in the Case of Forest Fires in Tohoku, 2017. In _Proceedings of the 38th IAHR World Congress_, Panama City,
Panama, 3822–3828 (2019). * Loveland, T. R. et al. Development of a global land cover characteristics database and IGBP DISCover from 1 km AVHRR data. _Int. J. Remote Sens. _21, 1303–1330
(2000). Article Google Scholar * Masson, V., Champeaux, J. L., Chauvin, F., Meriguet, C. & Lacaze, R. A Global Database of Land Surface parameters at 1-km resolution in Meteorological
and Climate models. _J. Clim. _16, 1261–1282 (2003). Article ADS Google Scholar * Kamiguchi, K. et al. Development of APHRO_JP, the first Japanese high-resolution daily precipitation
product for more than 100 years. _Hydrol. Res. Lett. _4, 60–64 (2010). Article ADS Google Scholar * Yatagai, A. et al. APHRODITE: constructing a long-term Daily Gridded Precipitation
dataset for Asia based on a dense network of rain gauges. _Bull. Am. Meteorol. Soc. _93, 1401–1415 (2012). Article ADS Google Scholar * Kotsuki, S., Tanaka, K., Kojiri, T. &
Hamaguchi, T. Simulation of Global Water cycle in Land using a crop calendar specified by phenological analysis of NDVI. _J. Jpn Soc. Hydrol. Water Resour. _25, 373–388 (2012). Article
Google Scholar * Tinumbang, A. F. A. et al. Developing a methodology for Model Intercomparison and its application to improve simulated streamflow by Land Surface models. _J.
Hydrometeorol_. 24, 817–833 (2023). Article ADS Google Scholar * Tanaka, K. Accuracy evaluation of Soil Moisture Estimation based on Water Balance. _J. Hydraul Eng. JSCE_. 53, 403–408
(2009). Google Scholar * Oki, R. & Sumi, A. Sampling Simulation of TRMM Rainfall Estimation using Radar-AMeDAS composites. _J. Appl. Meteorol. Climatol_. 33, 1597–1608 (1994). Article
ADS Google Scholar Download references AUTHOR INFORMATION AUTHORS AND AFFILIATIONS * Disaster Prevention Research Institute, Kyoto University, Gokasho, Uji, Kyoto, 611-0011, Japan Chenling
Sun, Yoshiya Touge & Kenji Tanaka * China Institute of Water Resources and Hydropower Research, Beijing, 100038, China Ke Shi Authors * Chenling Sun View author publications You can
also search for this author inPubMed Google Scholar * Yoshiya Touge View author publications You can also search for this author inPubMed Google Scholar * Ke Shi View author publications You
can also search for this author inPubMed Google Scholar * Kenji Tanaka View author publications You can also search for this author inPubMed Google Scholar CONTRIBUTIONS All authors
contributed to the study’s conception and design. C.S. conceptualized the study, performed the data analysis, and wrote the original draft. Y.T. contributed to the conceptualization,
methodology, data collection, and reviewed and edited the manuscript. K.S. was responsible for the methodology, and reviewed and edited the manuscript. K.T. provided supervision and
contributed to the methodology. All authors reviewed the manuscript. CORRESPONDING AUTHOR Correspondence to Yoshiya Touge. ETHICS DECLARATIONS COMPETING INTERESTS The authors declare no
competing interests. ACKNOWLEDGEMENTS This work was conducted by Theme 4 of the Advanced Studies of Climate Change Projection (SENTAN Program) Grant Number JPMXD0722678534, Grant-in-Aid for
Scientific Research (A), 2024–2027 (24H00336; Yoshiya Touge), and Grant-in-Aid for Scientific Research (B), 2020–2023 (20H02248; Yoshiya Touge) supported by the Ministry of Education,
Culture, Sports, Science and Technology (MEXT), Japan. ADDITIONAL INFORMATION PUBLISHER’S NOTE Springer Nature remains neutral with regard to jurisdictional claims in published maps and
institutional affiliations. ELECTRONIC SUPPLEMENTARY MATERIAL Below is the link to the electronic supplementary material. SUPPLEMENTARY MATERIAL 1 RIGHTS AND PERMISSIONS OPEN ACCESS This
article is licensed under a Creative Commons Attribution-NonCommercial-NoDerivatives 4.0 International License, which permits any non-commercial use, sharing, distribution and reproduction
in any medium or format, as long as you give appropriate credit to the original author(s) and the source, provide a link to the Creative Commons licence, and indicate if you modified the
licensed material. You do not have permission under this licence to share adapted material derived from this article or parts of it. The images or other third party material in this article
are included in the article’s Creative Commons licence, unless indicated otherwise in a credit line to the material. If material is not included in the article’s Creative Commons licence and
your intended use is not permitted by statutory regulation or exceeds the permitted use, you will need to obtain permission directly from the copyright holder. To view a copy of this
licence, visit http://creativecommons.org/licenses/by-nc-nd/4.0/. Reprints and permissions ABOUT THIS ARTICLE CITE THIS ARTICLE Sun, C., Touge, Y., Shi, K. _et al._ Assessment of the
suitability of drought descriptions for wildfires under various humid temperate climates in Japan. _Sci Rep_ 14, 23759 (2024). https://doi.org/10.1038/s41598-024-75563-2 Download citation *
Received: 31 May 2024 * Accepted: 07 October 2024 * Published: 10 October 2024 * DOI: https://doi.org/10.1038/s41598-024-75563-2 SHARE THIS ARTICLE Anyone you share the following link with
will be able to read this content: Get shareable link Sorry, a shareable link is not currently available for this article. Copy to clipboard Provided by the Springer Nature SharedIt
content-sharing initiative