Truncation in the scaling of urban pollution control
- Select a language for the TTS:
- UK English Female
- UK English Male
- US English Female
- US English Male
- Australian Female
- Australian Male
- Language selected: (auto detect) - EN
Play all audios:

ABSTRACT Urban scaling models assume homogeneous stochastic processes across a city system exhibiting power-law behavior. Strong persistent systematic factors may, however, cause deviations
from scaling curves and reflect local heterogeneities in processes that govern individual cities’ conformity to system mean trends. We conduct a scaling analysis across several quantitative
properties of municipal pollution performance in Chinese cities and verify the findings using data from Japan, South Africa, India, and European cities. A generalized truncated power-law
model is proposed to capture the region where performance metrics for small cities fall below the linear-fitted curve. We hypothesise that the truncation arises from limited capability of
smaller cities in performing pollution abatement activities requiring high process complexity. Pollution control strategies that facilitate the transition from a fragmented response of each
small city to a collaborative mode can provide a solution to even-out lags and inequalities across the national urban system. SIMILAR CONTENT BEING VIEWED BY OTHERS WORLDWIDE SCALING OF
WASTE GENERATION IN URBAN SYSTEMS Article Open access 17 January 2024 HETEROGENEOUS INFLUENCES OF URBAN COMPACTNESS ON AIR POLLUTION: EVIDENCE FROM 285 PREFECTURE-LEVEL CITIES IN CHINA
Article Open access 24 January 2025 URBAN AND AIR POLLUTION: A MULTI-CITY STUDY OF LONG-TERM EFFECTS OF URBAN LANDSCAPE PATTERNS ON AIR QUALITY TRENDS Article Open access 29 October 2020
INTRODUCTION The unprecedented increase in number and size of cities since the 1950s1,2,3 has reshaped the Earth’s surface and changed the complex relationship between humans and nature4,5.
Urban population growth is both humanly productive and environmentally damaging. More people on the planet means more consumption of resources6 and higher waste generation, especially
municipal pollution (e.g., domestic sewage and solid waste)7. Meanwhile, as more of the human species cluster in cities, their interactions drive nonlinear increments in production,
productivity, and output of all social products, good and bad8. The urban sprawl, rising population density, and greater energy input and industrial output associated with urbanization all
exacerbate man-environment conflicts. Optimum city size has long fascinated urban scholars9 as a normative issue. Scaling studies provide an approach for examining the question empirically
in respect of a human population’s revealed preference for clustering, and size-adjusted environmental performance10. It remains unclear, with the present state of knowledge, whether large
or small cities perform better in managing their pollution. The processes are clearly complex. While the question can be examined by econometric modeling to disambiguate contributing
factors, in this paper, we limit ourselves to capturing whole-system complexity effects in the urban scaling tradition, taking population as an indicator of complexity. We depict urban
environmental performance by a general power-law function \(Y={Y}_{0}{N}^{\beta }\), where \(Y\) represents the quantity of an environmental indicator, \({Y}_{0}\) is a constant, \(N\) is
urban population, and \(\beta\) is scaling exponent11,12,13. Scaling studies of urban environmental attributes are few14,15, and primarily focused on emissions16. Mixed findings have been
reported, with scaling exponents of carbon emissions ranging from 0.31 to 1.5117,18,19,20, municipal wastes from 0.85 to 1.1521,22 and air pollutants from 0.18 to 1.227,23,24,25, varying
across study context. Emissions are only part of the story, however. A city’s accumulated infrastructural capability for pollution abatement, meaning the technological and operational
capacities dedicated to mitigating environmental externalities, also matters when determining city size-performance relationships26. The widely-validated sublinear scaling of generic urban
infrastructure (e.g., road, urban impervious surfaces), with exponents of around 5/627,28,29, is driven by economies of scale. However, pollution control infrastructure operates under
fundamentally different driving factors and constraints. Whereas road and impervious land expand to accommodate existing and projected growth of human interactions, pollution control
infrastructure may respond to accumulated, sometimes unsolved environmental pressures or regulatory shocks. Its development is demand-driven and contingent upon waste generation patterns,
treatment targets, and socioeconomic adaptive capacity. A lack of understanding of this scaling leads to questions about how city size tends to intensify or alleviate the balance between
pollution generation and pollution control. It may be, for example, that some kinds of waste grow linearly with population size while the corresponding waste treatment infrastructure grows
less than per capita. There are two opposing effects as cities of increasing size attempt to manage their waste. Larger cities have been found to generate higher absolute volumes of
pollution at an aggregate level30,31. Meanwhile, larger cities also exhibit stronger economic and technical capacities to tackle pollution as a whole, since cities’ wealth and innovation
increase at a faster rate than population growth15,32,33 due to agglomeration economies. They foster knowledge spillovers, labor-market pooling, and closer linkages among transaction
participants compared to smaller cities. This is especially so for activities with higher complexity (i.e., those requiring a deeper division of knowledge, labor, capital, as well as
government and market institutions34,35). This implies spatial inequality in treatment capacity and outcome across cities. Urban scaling laws of these interconnected environmental attributes
are essential for revealing the opposing relationships at a whole city system level, which remain underexamined. Doing so, as we show, reveals an issue that is not yet fully addressed in
urban performance modeling: the treatment of parts of an urban system curve that deviate systematically from the expected log–log linearity. Our paper investigates this for environmental
performance quantities that deviate negatively from the system trend at the lower end of city size. We explore the use of truncated scaling models and caution against over-simplified
interpretation of traditional power-law models. By definition, scaling methods embed a strong homogeneity assumption across scale32,36, deriving the exponent \(\beta\) by a linear fitting of
log-transformed urban attributes versus population size. This will result in biased estimates of the scaling exponent when the performance-size scaling relationship is heterogeneous across
the city size range. If urban environmental performance varies with size-related factors such as affluence and technology, captured by systematic deviation from a power-law trend at certain
size ranges, then there is an argument for endogenising the effect in a modified scaling model37,38,39. Strong persistent systematic factors can lead to truncations in the heads or tails of
the distribution for many attributes in natural or anthropogenic systems40,41,42,43,44, normally regarded as a fall-off region and reflecting start-off or fall-off dynamics. Under this
circumstance, a simple log–log OLS (ordinary least squares) model is misleading since the truncation is ignored by, and is likely to distort, the fitting process42, thus limiting our
understanding of heterogeneities in stochastic processes across a city system. Researchers have proposed different methods to address issues in the tail of the power-law distribution, such
as adopting an unbiased test method45 or a switching model46 between the lognormal and the power-law; fitting with stepwise functions47; and proposing new functions with truncated parts to
capture nonlinearities40,41. This paper aims to propose a functional form for scaling in urban pollution control that exhibits satisfactory performance in terms of goodness-of-fit, broad
applicability to pollution-related metrics, and high interpretability which can inform urban environmental management strategies. We compared the proposed model with the traditional scaling
model and several other truncated ones, and discussed their performance with multi-year datasets. Does population size enhance or reduce a city’s ability to realize pollution control? Using
population size to represent the aggregated motivations and resourcefulness that generate social products, is a fundamental assumption in city scaling. It links to city centrality, function,
and tax revenues that can affect resource allocation for environmental enhancement. Environmental waste is a by-product of the collective endeavors of an urbanized population and
environmental waste management systems are a collective response. We conduct a scaling analysis across a set of quantitative properties relating to municipal pollution in China and verify
the findings using data from Japan, South Africa, India, and European cities. We find that the traditional homogeneity hypothesis in city scaling fails to characterize the statistical
properties of urban pollution control features as the process complexity increases, and we propose a truncated power-law model to estimate scaling exponents which better depict the pattern
with a fall-off region corresponding to small cities. The identified threshold size of a national urban system implies cities that need special policy attention. In sum, modeling the
truncation rather than ignoring it, provides a more nuanced understanding of the size-related insufficiency of cities to cope with the complexity of pollution control activities. RESULTS
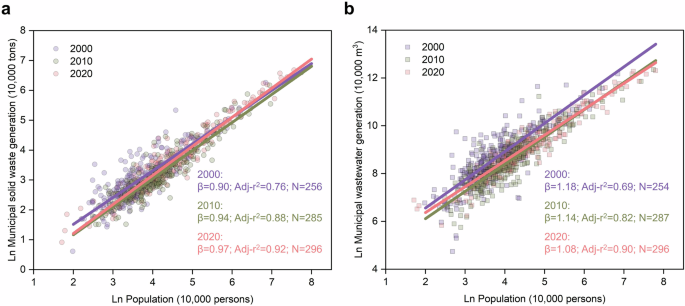
SCALING OF MUNICIPAL POLLUTION GENERATION The scaling of urban pollution generation is an appropriate first step in assessing whether pollution control capacity matches pollution treatment
demand as population increases. We found sublinear scaling properties (Fig. 1a), which imply that inhabitants living in larger Chinese cities generate less solid waste per capita on average.
We also found similar sublinear scaling patterns in German cities (\(\beta =0.92\)) and Japanese cities (\(\beta =0.97\); Figs. S1 and S2), indicating that solid waste production appears to
display economies of scale. This is surprising, since city-level per capita solid waste generation has widely been found to correlate positively with GDP48,49, as a wealthier economy tends
to have more extravagant and resource-consuming lifestyles. But urban scaling models capture multiple effects of human interaction simultaneously. The result corroborates previous research
that lower levels of demand management, environmental regulation, and public education in smaller and poorer cities lead to higher per capita waste generation compared to larger cities50,51.
This indicates that the weaker capacity in small poor cities to collectively implement advanced waste management overrides the income effect (demand for more waste in larger and richer
cities), exhibiting overall increasing returns in costs of urban economy. From 2000 to 2010, there was a significant decrease in solid waste generation in small cities in China (as indicated
by the transition from the purple to green fitting line in Fig. 1a), suggesting a more environmentally friendly consumption behavior. During 2010–2020, waste generation increased more
substantially in large cities (evidenced by the shift from the green to pink fitting line), which suggests a stronger income effect. These two trends contribute to a shift toward a more
linear scaling exponent over the observation period. In contrast to the pattern of solid waste, larger cities generate municipal wastewater in disproportionately higher quantities with
respect to population size (Fig. 1b). This is another surprising finding since water consumption is expected to scale linearly with population size, being an urban attribute closely related
to individual needs11,52. Our empirical observations for 144 European cities (\(\beta =1.04\)) and 414 Class I cities in India (\(\beta =1.06\)) also support a mildly superlinear
relationship (Figs. S3 and S4). Water resources are essential for maintaining high-quality urban amenities, and social interconnectivity in large cities can intensify the need for extra
water addition to per capita private consumption demand53. Cities attract inhabitants by the public shared goods supplied. The larger the cities, the greater the ratio of public to private
goods54, and most public goods, like any other product, generate wastewater. We test this assertion in Fig. S5. In addition, the underpricing of water may amplify its consumption in urban
production as cities grow. Similar to the trend of solid waste generation, a more linear scaling exponent can be observed for wastewater over time (from 1.18 to 1.08). From 2000 (purple
line) to 2020 (pink line), a reduction in water demand can be observed across all cities, with a more pronounced water-saving effect in larger cities, likely due to their advanced
facilities, water prices adjustments, and water-consciousness campaigns. In addition, we note that for both solid waste and wastewater, the fit becomes tighter over the 20-year period, as
evidenced by higher values of _r_2, indicating a maturing of China’s urban system in terms of waste production. Both have become more systematically related to population size as urban
inhabitants and governments learn how to live more efficiently in cities of all sizes. We note that this was a very dynamic period in China’s urban history in terms of personal enrichment,
economic deepening, and the rapid evolution of municipal government in a mixed-market economy55. SCALING OF MUNICIPAL POLLUTION CONTROL Pollution treatment can be expected to exhibit a
similar scaling pattern to pollution generation if pollution control capacity does not vary significantly across cities. As Fig. 2 depicts, compared with municipal solid waste generation in
2020 (\(\beta =0.97\)), the quantity, capacity, and infrastructural support for municipal solid waste treatment all indicate a fit within the bounds of expectation. All three wastewater
treatment exponents also correspond closely to the generation exponent (~1.08). These consistencies, especially the same exponents for waste production and quantity treated, indicate
efficient and adequate treatment across city sizes in China, evidencing the governments’ claim of 99.7% and 97.5% treatment rates in 2020, respectively56. We note that solid waste treatment
capacity and trucks and equipment quantity are more varied across cities than actual treatment, with a greater spread of under- and over-capacity compared to the population-size-related
means. The latter may be attributed to variations in the capacity of equipment which affect their deployment quantity. For wastewater treatment the fits are generally tighter, and we suggest
that the difference reflects the difficulties that municipalities have in siting and upgrading municipal waste facilities, be they landfills or processing plants. TRUNCATION IN THE SCALING
OF POLLUTION CONTROL WITH HIGHER PROCESS COMPLEXITY In this section, we show that other urban waste treatments with varying complexity display deviations from scaling laws, which can be
better captured by a truncated power-law model. Sewage sludge is a main secondary pollutant in wastewater treatment, which needs to be properly treated57 in every city. Historically, the
sludge treatment rate has been much lower than wastewater in China due to factors such as incomplete separate drainage systems, strict selection criteria of techniques, and limited options
for final disposal58. Figure 3a depicts the scaling of sewage sludge treated in Chinese cities (green triangles) in 2020. A traditionally fitted power-law function yields a superlinear
scaling relationship with a \(\beta\) of 1.29 (black straight line in Fig. 3a). However, there is a fall-off region, where small cities tend to fall below the national trend. To capture the
deviation, we investigated the power-law with exponential cutoff59 and fitted a truncated power-law model as follows, adding an exponential term \({e}^{-\frac{k}{N}}\) to the traditional
urban scaling model to characterize the fall-off in small cities. $$Y=a{N}^{\beta }{e}^{-\frac{k}{N}}$$ (1) where \(\beta\) represents the underlying power-law exponent when the truncated
region has been corrected for via \(k\); \(k\) is a parameter linking to environmental performance shortfalls in small cities compared to what they should behave; and \(a\) is a
normalization constant. \(k\) does not indicate a specific cut-off point, but rather characterizes the extent of underperformance experienced by small cities, estimated under the condition
of best fit using the Levenberg–Marquardt algorithm. For a given value of \(k={k}_{0}\), cities with population \({k}_{0}\) would, on average, suffer an evident decay rate of 63.2%
(\(1-{e}^{-1}\)), while cities with population \(10{k}_{0}\) correspond to a considerably lower decay rate of 9.5% (\(1-{e}^{-0.1}\)). Urban systems with higher values of \(k\) have a more
truncated pattern, that is, smaller cities perform worse, because of the K/N term in the second exponent expression. When \(k\)=0, Eq. (1) is reduced to the traditional power-law function,
indicating no truncation. Equation (1) thus has a universal form that applies to distributions that are truncated or not. We also proposed two alternative truncated models (Eqs. (2) and (3))
based on a review of the literature, and compared the fitting performance of all truncated and non-truncated traditional scaling models from the perspectives of goodness-of-fit (using _r_²
and Adjusted-_r_²), prediction accuracy (using Mean Squared Error and Root Mean Squared Error), model parsimony (using Akaike Information Criterion), and residual normality (using
Kullback–Leibler divergence) (see methodological details in the “Methods” section). $$Y=a({N}^{\beta }-{c}^{\beta }),$$ (2) $$\begin{array}{c}Y=\left\{\begin{array}{cc}a{N}^{\beta 1} &
(if\,\mathrm{In}\,N\,\ge \,c)\\ a{N}^{\beta 1}{e}^{\beta 2(\mathrm{ln}N-{\rm{c}})} & (if\,\mathrm{In}\,N\, < \,c)\end{array}\right.\end{array},$$ (3) where \(\beta\) in Eq. (2) and
\(\beta 1\) in Eq. (3) represent the underlying power-law exponent; \(a\) is a normalization constant; \(c\) in Eq. (2) is the parameter modeling the performance decay, and \(c\) in Eq. (3)
is the cut-off point of two functions. Table 1 reports the fitting performance of each model using empirical data in Fig. 3a, with parameter estimation results and fitted images shown in
Fig. S6. All truncated models exhibit better goodness-of-fit and higher prediction accuracy compared to the traditional scaling model. The improvement in fit outweighs the penalty for added
model complexity (lower AIC value), and the residual distribution is closer to the standard normal distribution (lower Kullback–Leibler divergence). Among the three truncated models,
although Eq. (3) performs slightly better than Eq. (1), we choose the latter for two reasons. First, Eq. (3) shows poor performance in other empirical cases discussed later, whereas Eq. (1)
can be widely applied. Second, Eq. (3) yields a specific cut-off city size (\(c\)), excluding cities below this size from the scaling analysis entirely. This approach does not align with
understanding urban dynamics from a whole-system perspective, while Eq. (1) applies over the entire range of empirical data, capturing continuous changes. As Fig. 3a shows, the sludge
scaling distribution for all cities is better approximated by Eq. (1) (red curve) compared to a non-truncated scaling curve (black line). We further performed a stepwise exclusion of small
cities and re-estimated scaling exponents using the traditional method, generating a series of descending values approaching the estimated underlying power-law exponent as more cities were
excluded (Fig. 3b). This comparison reveals that city groups of different size ranges have different scaling performance using traditional urban scaling analysis. This contradicts the
scale-free homogeneity assumption central to simple allometric theory, necessitating incorporation of scale-dependent mechanisms. A traditional scaling model, in this case, overestimates the
exponent due to systematically lower performance of the smallest cities. The bias risks misinterpretation and misunderstanding, such as false determination of superlinear or sublinear
scaling classification, overestimation of agglomeration economies of scale and returns to scale, and inflated expectations for large cities when estimating city performance according to
population size60,61. The more general issue is the stability of \(\beta\) exponents and appropriate functional form61,62,63. Responding to nonlinearities in log-transformed scaling models
and to instability in scaling exponents with urban boundary definition, researchers have modeled fluctuations in \(\beta\) with modifiable urban units61; identified scaling region only in
part of the distribution64; and fitted multiple functions to different portions of the distribution47. Rather than excluding deviant cases, our approach rectifies \(\beta\) by modeling
deviations directly in the fitted system curve. This has the advantage of parameterizing the truncation as part of the system, at the same time as preserving a best fit for the non-truncated
part. Figure 3b illustrates that under a size threshold of approximately 500,000 persons, cities tend to underperform in pollution control as expected. Figure 3c–e illustrate the
application of Eq. (1) and non-truncated models to multi-year datasets (2006, 2010, and 2015), with comparisons of fitting performance across alternative models reported in Table S1–S3.
Although Eq. (1) does not always perform best across all indicators in different cases, it exhibits good performance regarding goodness-of-fit and prediction accuracy. More importantly, the
change of parameter \(k\) in multiple years shows a system-wide improvement of sludge treatment performance and has policy relevance. Over the 2006–2020 period, \(k\) declines from 19.91 to
9.12 (Fig. 3a, c–e), indicating a shrinkage of the truncation effect and revealing that small cities in China continued to catch up with the average level of sludge treatment. This is seen
in the trajectory of quantity of sludge treated for individual cities (Fig. S7). We interpret this to mean that the complexity of sludge treatment no longer exerted the same level of
constraint on small cities that it once did. The truncation threshold population of around 0.5~1 million with possible fluctuations, corresponds to small- to medium-sized cities in China’s
official classification of urban hierarchy. Adding a policy focus on smaller cities, such as by extra subsidy for their sludge treatment, is likely to improve the environmental performance
of the whole Chinese urban system. This exemplifies how urban scaling studies can guide national and regional urban and environmental policy, by regulating the systematic influences on the
residual curve65. Comparison of truncated features (existence and degree) in scaling patterns reveals discrepancies in the sufficiency level of pollution control. Figure 4a indicates a
truncation point in municipal wastewater secondary and tertiary treatment capacity in the 2000 distribution, with truncated exponent \(\beta =1.10\) and \(k=12.03\). The non-truncated
\(\beta\) of 1.28 is misleadingly high due to the low values of the smaller cities bending the curve upward61. In 2000, establishing adequate treatment capacity was still a challenge for
many small cities. By 2010, the \(\beta\) estimate remains almost the same at 1.09, but truncation is barely evident, indicating that small cities in China had eliminated the capacity gap,
developing sufficient capacity to deal with complex secondary and tertiary wastewater treatment and better conforming to the overall superlinear scaling. The trend is captured in the plotted
trajectory for individual cities (Fig. S8), the 2020 \(\beta\) of 1.10, and an even tighter fit with no truncation. We take the consistency of \(\beta\) over time and the disappearance of
small-city technology disadvantage as evidence of a real and stable underlying scaling dynamic. This pattern may arise from cross-system knowledge spillovers that accelerate the diffusion of
advanced technologies and innovation, economic diversification enhancing resource allocation efficiency, and the maturing of practices relating to urban public goods65 and services66. We
note that a technological capacity argument only holds for complex technologies likely to be affected by threshold effects. The ability of small and less-developed communities to deal with
waste and other ‘commons’ problems through traditional institutions and technologies, is well understood67. Figure 4b compares the distributions of two properties related to wastewater
treatment: quantity of wastewater treated and quantity of recycled water. The former does not reveal truncation, while the latter does. This suggests that wastewater reuse, which is more
costly, requires more advanced technologies than basic wastewater treatment, and has higher social production process complexity, still poses challenges for small cities in China. There is a
city size threshold of approximately 300,000–500,000 persons under which cities require targeted improvements to their wastewater reuse capabilities. ADDITIONAL COST TO SMALL CITIES IN
PERFORMING COMPLEX POLLUTION CONTROL ACTIVITIES Apart from population, financial and technical capacity greatly influence a city’s capability for handling pollution, as captured in the
classic IPAT model68. This provides us with a perspective for interpreting truncation in national system scaling laws for complex pollution control. Scaling patterns of municipal investments
in pollution control and the number of green patents across Chinese cities exhibit truncations (Fig. 5a, b). This challenges the urban scaling idea of municipal infrastructure trending as
log–log sublinear and investments and ‘inventing’ activity as log–log superlinear. An estimated \(k\) of 8.08 in Fig. 5a indicates that Chinese cities below a population threshold of 500,000
persons, can be expected to suffer an under-capacity penalty of 14.9% (1-\({e}^{(-\frac{8.08}{50})}\)) in terms of fixed assets investment in urban wastewater treatment and environmental
sanitation facilities, on average, compared with 1.6% (1-\({e}^{(-\frac{8.08}{500})}\)) for a city of 5 million persons. Graphing per capita GDP in Fig. 5 reveals that the difference in
environmental economic and technical capability between large and small cities is not fully an income effect. Smaller cities in China are not necessarily poorer cities, measured by per
capita GDP, but they nevertheless show a systematic deficiency in investment, low technical innovation, and pollution control under-capacity. This is also true of the very smallest cities,
which are not the poorest and located mostly in Tibet, Yunnan, and Gansu provinces, where GDP has been enhanced relative to size, by natural resources and tourism and by national transfer
payments. The observation strengthens the interpretation of truncation being due both to urban complexity-related capacity and complexity of advanced pollution technology. In public goods
production, smaller cities are more vulnerable not only to cost factors (economic, technological, and others) but organizational, political, networking, and labor-market factors too, all of
which affect municipal management, innovation, and investment capacity. Besides institutional capacity factors, there are scale-economic factors65. As cities adopt more sophisticated
pollution control measures — requiring specialized expertise, advanced technologies, increased funding, and coordinated management — marginal cost and benefit change and without
institutional friction, pollution control would, in theory, stabilize to equate marginal cost and benefit69. Smaller cities have basic institutional limitations as noted, but also tend to
have higher marginal cost due to absence of economies of scale in infrastructural investment and lower capacity for technological output (Fig. 5). Higher treatment efficiency and lower
per-unit treatment costs of larger facilities have been verified across countries and waste types70,71. The capacity disadvantage of obtaining economies of scale contributes a threshold
effect, related to resource mobilization across multiple domains, including economic strength, technological support, specialized labor skills, public environmental awareness, and so on. As
a result, smaller cities only perform well in pollution control at a lower level of process complexity with lower marginal cost; and this is likely to manifest in the truncated part of the
curve. We thus capture an exponentially increasing vulnerability to capability lag in environmental management in the Chinese urban system. As the whole urban system becomes more mature, the
vanishing truncation indicates improved pollution control performance of small cities in addressing higher levels of complexity, either through gains in intrinsic capital and labor
capacities66, or spillover from larger cities of elements needed to overcome the threshold effects72. The threshold analysis of economic development and underlying infrastructure is well
studied73,74,75,76,77, but not yet so in scaling studies, partly because of lack of attention to heterogeneity in residuals. DISCUSSION Our study demonstrates that the tacit assumption of
homogeneity, or universality, in traditional urban scaling theory may not hold true across the entire system and is likely to lead to biased estimation of scaling exponents61,62,78 and we
have discussed the systematic bias in \(\beta\) exponents for urban properties relating to pollution control. There is a small literature on systematic deviations from the urban performance
power-law functions. Residual analysis of urban scaling models is now an accepted approach to identifying cities that are under- and over performing79,80,81,82, with the Scale-Adjusted
Metropolitan Indicator (SAMI) being a notable example, but not all look at the patterns of heterogeneous conformity to system mean trends systematically. Bettencourt et al.80 plotted a
cross-correlation matrix of time-series profiles of ranked standardized residuals from performance scaling models of US cities. This amounts to using patterns in residuals trends to identify
families of similarly performing non-contiguous cities. Arcaute et al. 61 used systematic truncation of scale-free performance curves to demonstrate how \(\beta\) exponents can move from
superlinear to sublinear as outliers are removed. More attention has been given to deviations from Zipf’s law and Gibrat’s law in national78,83,84 and global85,86 city size distributions,
particularly concerning the heads and tails of the distribution and their implications. Since the debate between Pareto distribution87 and lognormal distribution88, research has continually
refined testing methods45 and enhanced city boundary definitions46,78 that can substantially influence the scaling exponent89, as measuring urban population under different spatial contexts
is associated with heterogeneous growth dynamics90. Outliers in skewed distributions can also disrupt scaling laws, which can be detected using an adjusted boxplot91 and analyzed
separately92. Spatial dependence is another widely-concerned error-inducing factor93, as spatial proximity can greatly alter the number of effective interactions among individuals94. Studies
have adopted eigenvector spatial filtering models79 and generative models94 to address the influence of spatial autocorrelation. Our truncated power-law model provides estimations of
scaling exponents across all city sizes, statistically capturing small-city underperformance on pollution control goals. Speculatively, we interpret this as capturing intrinsic system
threshold effects in the capacity to supply local public goods65. A similar model could truncate at the upper size end to capture upper outliers, upper-end threshold effects, and log–log
nonlinearities, including diminishing economies and returns to scale as saturation thresholds are approached. As mentioned, another approach to tackling inverted hockey-stick log–log
distributions, is fitting a power function only for identified scaling region64. Another is to fit multiple functions to different portions of the distribution42,47. These approaches
encounter challenges due to the subjectivity in selecting demarcation points and justifying the choice of upper and lower bounds of the city size for scaling analysis. Comparatively, our
model is a robust and general approach to reveal evolution over the entire range of empirical data with a fixed form. We chose to model truncation via an exponential term
(\({e}^{-\frac{k}{N}}\)) that ‘bends’ the overall national urban system power-law, forming smoothened distribution over the entire curve, rather than as an alternative function for the
lowest city size range. Justification for this approach lies in the gradual transformation to a more linear curve over time – indicating better conformity to scaling laws (Figs. 3 and 4a,
Figs. S7 and S8). We conjecture that these are system-wide adjustment processes, not processes that are independent for fixed city size ranges. The generality of our model is evidenced by
its application in the case of urban wastewater treatment in South Africa and solid waste treatment in Japan (Fig. 6). Worse performance of smaller municipalities in South Africa regarding
complex technology capacity and total current asset value for wastewater treatment can be demonstrated by the truncation. In Japan’s case, waste recycling scaling demonstrates truncation,
with recycling being a relatively more complex activity that presents significantly higher challenge for the smallest prefectures compared to waste incineration (no truncation in scaling).
The much tighter fit regarding waste incineration also indicates a more equitable development across city size range, which is similar to the case of China’s wastewater reuse (Fig. 4b). The
decrease of \(k\) in the scaling of waste recycling capacity from 29.47 in 2010 to 16.49 in 2018 also indicates technological progress over time in small prefectures of Japan. The challenges
of small cities in pollution control are observed in other developing countries around the world. Table S4 compares the distributions of urban wastewater treatment capacity among cities of
different sizes in India (2005), Brazil (2017), and South Africa (2021), covering a total of 2547 municipalities. The insufficiency of treatment capacity is always most severe in the
smallest group of cities, while the largest 25% of cities all show significantly larger treatment capacity. One way of looking at this, in terms of truncated scaling laws, is that the
\(k\)-coefficients kick in at a large population size, and the under-capacity effect caused by small population size has affected most cities. Only the largest cities — often the core urban
centers - have sufficiently powerful political, economic, and technological strength to mobilize resources across sectors for better pollution reduction. Agglomeration economies of scale
produce inequalities as well as growth. Our results show that the gap in pollution control services between China’s larger and smaller cities over two decades is more significant in
less-developed urban systems (Figs. 3 and 4a). We conclude that truncations in the scaling patterns are typical for environmental technology and that this finding has significant
implications for urban environmental management. Strategies that enhance the transition from separated and fragmented responses by each small city, to a collaborative and interconnected
mode, may point to a fundamental solution for speeding the evening-out (levelling-up) of the overall systems curve over time. Our analysis supports the case for re-allocation of capital and
technical resources to small cities to overcome threshold effects. In addition, in-depth cooperation among cities can hasten technical diffusion and enhance multiplicative processes of
innovation adoption, highlighting the influence of spatial interactions on system scaling. This can be further verified through spatial econometric models93. City innovation networks
focusing on pollution control demand and capacity, can help generate synergistic, learning, and even federation effects. Joint construction and sharing of treatment facilities among
neighboring cities, especially for pollutants that require significant economic and technical support to manage, could be an effective way of breaking the constraints of small population in
respect to construction cost, capacity, and economic sustainability of pollution treatment95,96. This can be particularly beneficial for cities in western and northeastern China clustered
around mineral and other resources, which have low population density and capacity gap in developing sufficient pollution control infrastructure. In summary, our work proposes a general
model of truncations in scaling of environmental performance indicators that captures spatial and size inequalities and urban developmental dynamics over time. We highlight two specific
advantages of the approach. First, it better depicts the statistical properties of urban pollution control features and allows modeling of \(\beta\) convergence. It adds to the current
literature on urban allometry, particularly discussion about inconsistency of \(\beta\) and how to recover systematic information from deviations to system means. Second, it identifies
regions that deserve special policy attention, and reveals the necessity of system-wide management strategies for pollution treatment. We demonstrate that truncations in power-law rules,
governing urban environmental performance reliant on highly complex organization of human-technology-environment interactions, are better understood rather than ignored. Our truncation
parameter _k_ yields important information otherwise lost. It reveals the rate (over size and over time) at which social products are generated within the black-box of a city’s complex
self-organizing networks of knowledge and resource exchange. This study has limitations that should be considered. Firstly, the model proposed primarily addressed the unconformity of small
cities to system-wide mean trends. If outliers in the upper tail (e.g., largest cities) were removed, the fitting model and scaling laws might differ significantly. However, as urban
pollution control is driven by demand, although larger cities have additional resources, they are unlikely to overinvest in treatment facilities only to meet their specific needs, which
prevents them from being outliers in the upper tail. Second, city definition could influence the scaling coefficients, which can be tested for robustness by adopting alternative measurement
of urban population in future research. Finally, spatial interactions between cities may also impact the findings, which can be further examined using spatial econometric models93. METHODS
DATA For Chinese cities, we collected the data relating to urban population, pollution generation, pollution treatment, and fixed assets investment for sewage and environmental sanitation
from _China Urban Construction Yearbook_ in 2000–2020, published by the Ministry of Housing and Urban-Rural Development of the People’s Republic of China. The administrative division of
prefecture-level cities was set based on the National Bureau of Statistics in China. Specifically, city size is characterized by the urban permanent population, which is calculated as the
sum of the urban registered population and the urban temporary population. The green patent data was obtained from the Chinese Research Data Services (CNRDS) platform. The selection
criterion for green patents refers to the IPC (International Patent Classification) Green Inventory, which provides classification for environmentally sound technologies. For our modeling of
Indian cities, data on urban population, urban sewage generation, and existing sewage treatment capacity came from an official report titled _Status of Sewage Treatment in India_ published
by the Central Pollution Control Board of India. All 414 Class I Indian cities (having more than 100,000 persons) and 489 Class II towns (having 50,000–100,000 persons) are included. In the
case of Brazil, we acquired data on urban population and urban sewage treatment capacity for 1501 municipalities in 2017 from the _Diagnosis of Water and Sewage Services_ released by the
Ministry of Regional Development, based on data from the National Sanitation Information System. For South Africa, urban population data for 143 municipalities came from the _Community
Survey 2016_ provided by Statistics South Africa, and data on sewage treatment came from _The Green Drop 2022 report_ published by the Water and Sanitation Department, South Africa. Data for
European cities and Japan came from Eurostat and the Ministry of Environment Japan, respectively. More details about data collection are provided in Supplementary Note 1. MODEL COMPARISON
CRITERIA To evaluate the performance of different fitting models (i.e., the non-truncated traditional urban scaling model and the truncated models shown in Eqs. (1–3)), we employed multiple
statistical metrics and information-theoretic measures, including _r_² and Adjusted-_r_² for comparing goodness-of-fit, Mean Squared Error and Root Mean Squared Error for comparing
prediction accuracy, Akaike Information Criterion for balancing model fit and complexity, and Kullback–Leibler divergence for evaluating residual normality. GOODNESS-OF-FIT MEASURES _r_²
reflects the proportion of variance explained by the model, as Eq. (4) shows. $${{\rm{r}}}^{2}=1-\frac{\displaystyle {\sum }_{i=1}^{n}{({y}_{i}-{\widehat{y}}_{i})}^{2}}{\displaystyle {\sum
}_{i=1}^{n}{({y}_{i}-\overline{y})}^{2}}$$ (4) where \(y\) denotes the observation vector, \(\widehat{y}\) represents the model predictions, \(n\) indicates the number of observations, and
\(\overline{y}\) is the mean of observed values. Adjusted-_r_² is particularly useful for comparing multiple models as it accounts for the number of parameters (\(m\)), penalizing
unnecessary complexity (Eq. (5)). $${\rm{Adjusted}}-{{\rm{r}}}^{2}=1-(1-{r}^{2})\frac{n-1}{n-m-1}$$ (5) PREDICTION ACCURACY The Mean Squared Error (MSE) and Root MSE (RMSE) are calculated as
Eqs. (6) and (7) to provide a measure of predictive performance. $${\rm{M}}{\rm{S}}{\rm{E}}=\frac{1}{n}\displaystyle \sum _{i=1}^{n}{({y}_{i}-{\widehat{y}}_{i})}^{2}$$ (6)
$${\rm{RMSE}}=\sqrt{{\rm{MSE}}}$$ (7) MODEL PARSIMONY The traditional urban scaling model is nested within the truncated models, leading to concerns about whether the increased model
complexity can justify the improvement in fit. We address this with Akaike Information Criterion (AIC), shown in Eq. (8). $${\rm{A}}{\rm{I}}{\rm{C}}=-2{\rm{I}}{\rm{n}}\,{\mathcal{L}}+2m$$
(8) where \(\mathrm{ln}{\mathcal{L}}\) is the log-likelihood for Gaussian errors, calculated as Eq. (9). $${\rm{I}}{\rm{n}}\,{\mathcal{L}}=-\frac{n}{2}\left[\mathrm{ln}\,\left(2\pi
\frac{1}{n}\sum _{i=1}^{n}{({y}_{i}-{\widehat{y}}_{i})}^{2}\right)+1\right]$$ (9) Model with lower value of AIC is preferred since it performs better in the trade-off between explaining
variation and model simplicity. RESIDUAL NORMALITY In classical linear regression, the assumption of residual normality is fundamental to the reliability of statistical inference. If the
residuals of the truncated model are closer to a normal distribution, it may indicate that the model better satisfies the regression assumptions, thereby enhancing statistical robustness.
Consequently, we consider residual normality as a supplementary criterion for model comparison, evaluated by quantifying the Kullback–Leibler (KL) Divergence between residual distribution
(\(P\)) and standard normal distribution (\(Q\)), as Eq. (10) shows. $${D}_{KL(P\parallel Q)}=\sum _{x\in \chi }P(x){\rm{l}}{\rm{o}}{\rm{g}}\frac{P(x)}{Q(x)}$$ (10) \(P\) and \(Q\) are
estimated using kernel density estimation with Silverman’s rule for bandwidth selection. Probability densities were normalized for numerical stability. DATA AVAILABILITY All data used in
this study are publicly available. They can be downloaded or collected from the sources provided in the “Data” section and Supplementary Note 1. REFERENCES * Zhang, X. et al. A large but
transient carbon sink from urbanization and rural depopulation in China. _Nat. Sustain._ 5, 321–328 (2022). Article Google Scholar * Montgomery, M. R. The urban transformation of the
developing world. _Science_ 319, 761–764 (2008). Article CAS Google Scholar * UN. _World Urbanization Prospects: The 2018 Revision_.
https://www.un.org/development/desa/pd/content/world-urbanization-prospects-2018-revision (2018). * Wang, J. et al. Anthropogenic emissions and urbanization increase risk of compound hot
extremes in cities. _Nat. Clim. Chang._ 11, 1084–1089 (2021). Article CAS Google Scholar * Elmqvist, T. et al. Sustainability and resilience for transformation in the urban century. _Nat.
Sustain._ 2, 267–273 (2019). Article Google Scholar * Brelsford, C., Lobo, J., Hand, J. & Bettencourt, L. M. A. Heterogeneity and scale of sustainable development in cities. _Proc.
Natl Acad. Sci. USA_ 114, 8963–8968 (2017). Article CAS Google Scholar * Zheng, B., de Beurs, K. M., Owsley, B. C. & Henebry, G. M. Scaling relationship between CO pollution and
population size over major US metropolitan statistical areas. _Landsc. Urban Plan_ 187, 191–198 (2019). Article Google Scholar * Bettencourt, L. M. A. _Introduction to Urban Science:
Evidence and Theory of Cities As Complex Systems_ (MIT Press, Cambridge, MA, 2021). * Pflüger, M. City size, pollution and emission policies. _J. Urban Econ._ 126, 103391 (2021). Article
Google Scholar * Han, L., Zhou, W., Pickett, S. T. A., Li, W. & Li, L. An optimum city size? the scaling relationship for urban population and fine particulate (PM2.5) concentration.
_Environ. Pollut._ 208, 96–101 (2016). Article CAS Google Scholar * Bettencourt, L. M. A., Lobo, J., Helbing, D., Kuhnert, C. & West, G. B. Growth, innovation, scaling, and the pace
of life in cities. _Proc. Natl Acad. Sci. USA_ 104, 7301–7306 (2007). Article CAS Google Scholar * Bettencourt, L. M. A. & Lobo, J. Urban scaling in Europe. _J. R. Soc. Interface_ 13,
20160005 (2016). Article Google Scholar * Sahasranaman, A. & Bettencourt, L. M. A. Urban geography and scaling of contemporary Indian cities. _J. R. Soc. Interface_ 16, 20180758
(2019). Article Google Scholar * Keuschnigg, M. Scaling trajectories of cities. _Proc. Natl Acad. Sci. USA_ 116, 13759–13761 (2019). Article CAS Google Scholar * Bettencourt, L. The
origins of scaling in cities. _Science_ 340, 1438–1441 (2013). Article CAS Google Scholar * Gudipudi, R., Rybski, D., Ludeke, M. K. B. & Kropp, J. P. Urban emission scaling - research
insights and a way forward. _Environ. Plan B Urban Anal. City Sci._ 46, 1678–1683 (2019). Article Google Scholar * Oliveira, E. A., Andrade, J. S. & Makse, H. A. Large cities are less
green. _Sci. Rep._ 4, 1–13 (2014). Article Google Scholar * Fragkias, M., Lobo, J., Strumsky, D. & Seto, K. C. Does size matter? Scaling of CO2 emissions and U.S. urban areas. _PLoS
ONE_ 8, e64727 (2013). Article CAS Google Scholar * Ribeiro, H. V., Rybski, D. & Kropp, J. P. Effects of changing population or density on urban carbon dioxide emissions. _Nat.
Commun._ 10, 3204 (2019). Article Google Scholar * Louf, R. & Barthelemy, M. How congestion shapes cities: from mobility patterns to scaling. _Sci. Rep._ 4, 5561 (2014). Article CAS
Google Scholar * Lu, M., Zhou, C., Wang, C., Jackson, R. B. & Kempes, C. P. Worldwide scaling of waste generation in urban systems. _Nat. Cities_ 1, 126–135 (2024). Article Google
Scholar * Qu, S., Yu, K., Hu, Y., Zhou, C. & Xu, M. Scaling of energy, water, and waste flows in China’s prefecture-level and provincial cities. _Environ. Sci. Technol._ 57, 1186–1197
(2023). Article CAS Google Scholar * Lamsal, L. N., Martin, R. V., Parrish, D. D. & Krotkov, N. A. Scaling relationship for NO2 pollution and urban population size: a satellite
perspective. _Environ. Sci. Technol._ 47, 7855–7861 (2013). Article CAS Google Scholar * Yao, L., Xu, W., Xu, Y. & Sun, S. Examining the potential scaling law in urban PM2.5 pollution
risks along with the nationwide air environmental effort in China. _Int. J. Environ. Res Public Health_ 19, 4460 (2022). Article Google Scholar * Akuraju, V., Pradhan, P., Haase, D.,
Kropp, J. P. & Rybski, D. Relating SDG11 indicators and urban scaling - an exploratory study. _Sustain. Cities Soc._ 52, 101853 (2020). Article Google Scholar * Gómez-Sanabria, A.,
Kiesewetter, G., Klimont, Z., Schoepp, W. & Haberl, H. Potential for future reductions of global GHG and air pollutants from circular waste management systems. _Nat. Commun._ 13, 106
(2022). Article Google Scholar * Bergs, R. The policy relevance of urban scaling laws: a study on impervious ground in German cities. _J. Econ. Anal._ 4, 92 (2025). Google Scholar *
Brelsford, C., Coon, E. T., Moran V, E. & Allen-Dumas, M. Urban scaling as validation for predictions of imperviousness from population. _Geophys. Res. Lett._ 47, e2020GL089742 (2020).
Article Google Scholar * Ma, Q., Wu, J., He, C. & Hu, G. Spatial scaling of urban impervious surfaces across evolving landscapes: from cities to urban regions. _Landsc. Urban Plan_
175, 50–61 (2018). Article Google Scholar * Gudipudi, R., Fluschnik, T., Ros, A. G. C., Walther, C. & Kropp, J. P. City density and CO2 efficiency. _Energy Policy_ 91, 352–361 (2016).
Article CAS Google Scholar * Cheng, L., Mi, Z. F., Sudmant, A. & Coffman, D. Bigger cities better climate? Results from an analysis of urban areas in China. _Energy Econ._ 107, 105872
(2022). Article Google Scholar * Arvidsson, M., Lovsjö, N. & Keuschnigg, M. Urban scaling laws arise from within-city inequalities. _Nat. Hum. Behav._ 7, 365–374 (2023). Article
Google Scholar * Keuschnigg, M., Mutgan, S. & Hedstrom, P. Urban scaling and the regional divide. _Sci. Adv._ 5, eaav0042 (2019). Article Google Scholar * Hidalgo, C. A. &
Hausmann, R. The building blocks of economic complexity. _Proc. Natl Acad. Sci. USA_ 106, 10570–10575 (2009). Article CAS Google Scholar * Balland, P. A. et al. Complex economic
activities concentrate in large cities. _Nat. Hum. Behav._ 4, 248–254 (2020). Article Google Scholar * Gomez-Lievano, A., Patterson-Lomba, O. & Hausmann, R. Explaining the prevalence,
scaling and variance of urban phenomena. _Nat. Hum. Behav._ 1, 0012 (2016). Article Google Scholar * Gao, J. et al. Dilution effect of the building area on energy intensity in urban
residential buildings. _Nat. Commun._ 10, 4944 (2019). Article Google Scholar * Dong, Y., Xu, L., Yang, Z., Zheng, H. & Chen, L. Aggravation of reactive nitrogen flow driven by human
production and consumption in Guangzhou City China. _Nat. Commun._ 11, 1209 (2020). Article CAS Google Scholar * Sugar, L. & Kennedy, C. Urban scaling and the benefits of living in
cities. _Sustain. Cities Soc._ 66, 102617 (2021). Article Google Scholar * Burroughs, S. M. & Tebbens, S. F. Upper-truncated power law distributions. _Fractals_9, 209–222 (2001).
Article Google Scholar * Gonzalez, M. C., Hidalgo, C. A. & Barabasi, A. L. Understanding individual human mobility patterns. _Nature_ 458, 779–782 (2009). Article Google Scholar *
Burroughs, S. M. & Tebbens, S. F. Upper-truncated power laws in natural systems. _Pure Appl. Geophys._ 158, 741–757 (2001). Article Google Scholar * Quiroz, J. C. et al. Empirical
analysis of Zipf’s law, power law, and lognormal distributions in medical discharge reports. _Int. J. Med. Inf._ 145, 104324 (2021). Article Google Scholar * Ma, Q., Johansson, A. &
Sumpter, D. J. T. A first principles derivation of animal group size distributions. _J. Theor. Biol._ 283, 35–43 (2011). Article Google Scholar * Malevergne, Y., Pisarenko, V. &
Sornette, D. Testing the Pareto against the lognormal distributions with the uniformly most powerful unbiased test applied to the distribution of cities. _Phys. Rev. E_ 83, 36111 (2011).
Article Google Scholar * Ioannides, Y. & Skouras, S. US city size distribution: robustly Pareto, but only in the tail. _J. Urban Econ._ 73, 18–29 (2013). Article Google Scholar *
Sjoberg, M., Albrectsen, B. & Hjalten, J. Truncated power laws: a tool for understanding aggregation patterns in animals? _Ecol. Lett._ 3, 90–94 (2000). Article Google Scholar * He, R.
et al. Global knowledge base for municipal solid waste management: Framework development and application in waste generation prediction. _J. Clean. Prod._ 377, 134501 (2022). Article
Google Scholar * Beigl, P., Lebersorger, S. & Salhofer, S. Modelling municipal solid waste generation: a review. _Waste Manag._ 28, 200–214 (2008). Article CAS Google Scholar *
Izquierdo-Horna, L., Kahhat, R. & Vázquez-Rowe, I. Reviewing the influence of sociocultural, environmental and economic variables to forecast municipal solid waste (MSW) generation.
_Sustain. Prod. Consum._ 33, 809–819 (2022). Article Google Scholar * Grazhdani, D. Assessing the variables affecting on the rate of solid waste generation and recycling: an empirical
analysis in Prespa Park. _Waste Manag._ 48, 3–13 (2016). Article Google Scholar * Zhou, C. C., Gong, M. M., Xu, Z. C. & Qu, S. Urban scaling patterns for sustainable development goals
related to water, energy, infrastructure, and society in China. _Resour. Conserv. Recycl._ 185, 106443 (2022). Article Google Scholar * Meng, X., Tu, L., Yan, C. & Wu, L. Forecast of
annual water consumption in 31 regions of China considering GDP and population. _Sustain. Prod. Consum._ 27, 713–736 (2021). Article Google Scholar * Buettner, T. & Holm-Hadulla, F.
City size and the demand for local public goods. _Reg. Sci. Urban Econ._ 43, 16–21 (2013). Article Google Scholar * Warner, M. E. Reversing privatization, rebalancing government reform:
markets, deliberation and planning. _Policy Soc._ 27, 163–174 (2008). Article Google Scholar * Ding, Y. et al. A review of China’s municipal solid waste (MSW) and comparison with
international regions: Management and technologies in treatment and resource utilization. _J. Clean. Prod._ 293, 126144 (2021). Article Google Scholar * Styszko, K., Durak, J., Kończak,
B., Głodniok, M. & Borgulat, A. The impact of sewage sludge processing on the safety of its use. _Sci. Rep._ 12, 12227 (2022). Article CAS Google Scholar * Feng, L., Luo, J. &
Chen, Y. Dilemma of sewage sludge treatment and disposal in China. _Environ. Sci. Technol._ 49, 4781–4782 (2015). Article CAS Google Scholar * Chattopadhyay, S., Murthy, C. A. & Pal,
S. K. Fitting truncated geometric distributions in large scale real world networks. _Theor. Comput. Sci._ 551, 22–38 (2014). Article Google Scholar * Cottineau, C., Hatna, E., Arcaute, E.
& Batty, M. Diverse cities or the systematic paradox of urban scaling laws. _Comput. Environ. Urban Syst._ 63, 80–94 (2017). Article Google Scholar * Arcaute, E. et al. Constructing
cities, deconstructing scaling laws. _J. R. Soc. Interface_ 12, 20140745 (2015). Article Google Scholar * Leitão, J. C., Miotto, J. M., Gerlach, M. & Altmann, E. G. Is this scaling
nonlinear? _R. Soc. Open Sci._ 3, 150649 (2016). Article Google Scholar * Bettencourt, L. M. A. et al. The interpretation of urban scaling analysis in time. _J. R. Soc. Interface_ 17,
20190846 (2020). Article Google Scholar * Chen, Z., Liu, Y. & Zhou, P. A novel method to identify the scaling region of rough surface profile. _Fractals_ 27, 1950011 (2018). Article
Google Scholar * Webster, C. Tiebout, Coase and urban scaling. _Ann. Reg. Sci._ https://doi.org/10.1007/s00168-024-01272-3 (2024). * Qu, J. et al. Municipal wastewater treatment in China:
development history and future perspectives. _Front. Environ. Sci. Eng._ 13, 88 (2019). Article Google Scholar * Ostrom, E. _Governing the Commons: The Evolution of Institutions for
Collective Action_ (Cambridge Univ. Press, 1990). * Dietz, T. & Rosa, E. A. Rethinking the environmental impacts of population, affluence and technology. _Hum. Ecol. Rev._ 1, 277–300
(1994). Google Scholar * Harris, J. M. & Roach, B. _Environmental and Natural Resource Economics: A Contemporary Approach_, 3rd edn (M.E. Sharpe, Armonk, NY, 2013). * Wu, X. Y., Huang,
G. H., Liu, L. & Li, J. B. An interval nonlinear program for the planning of waste management systems with economies-of-scale effects—a case study for the region of Hamilton, Ontario,
Canada. _Eur. J. Oper. Res._ 171, 349–372 (2006). Article Google Scholar * Hernández-Chover, V., Bellver-Domingo, Á. & Hernández-Sancho, F. Efficiency of wastewater treatment
facilities: the influence of scale economies. _J. Environ. Manag._ 228, 77–84 (2018). Article Google Scholar * Hecker, L. P., Wätzold, F. & Markwardt, G. Spotlight on spatial
spillovers: an econometric analysis of wastewater treatment in Mexican municipalities. _Ecol. Econ._ 175, 106693 (2020). Article Google Scholar * Tang, Y. et al. Assessing the threshold
effects of road infrastructure construction on farmland use transition: an empirical study in China. _Environ. Sci. Pollut. Res. Int._ 29, 47323–47336 (2022). Article Google Scholar * Xu,
L., Wang, D. & Du, J. The heterogeneous influence of infrastructure construction on China’s urban green and smart development—the threshold effect of urban scale. _Land_10, 1015 (2021).
Article Google Scholar * Fan, J., Shen, Z. & Wang, Z. The threshold effect of urban levels on environmental collaborative governance: an empirical analysis from Chinese cities. _Int.
J. Environ. Res. Public Health_ 19, 3980 (2022). Article Google Scholar * Yao, F., Zhu, H. & Wang, M. The Impact of multiple dimensions of urbanization on CO2 emissions: a spatial and
threshold analysis of panel data on China’s prefecture-level cities. _Sustain. Cities Soc._ 73, 103113 (2021). Article Google Scholar * Ojah, K., Muhanji, S. & Kodongo, O.
Infrastructure threshold and economic growth in Africa: do income level and geography matter? _Econ. Chang. Restruct._ 55, 1587–1627 (2022). Article Google Scholar * Corral, Á., Udina, F.
& Arcaute, E. Truncated lognormal distributions and scaling in the size of naturally defined population clusters. _Phys. Rev. E_ 101, 42312 (2020). Article CAS Google Scholar * Xiao,
Y. & Gong, P. Removing spatial autocorrelation in urban scaling analysis. _Cities_ 124, 103600 (2022). Article Google Scholar * Bettencourt, L. M. A., Lobo, J., Strumsky, D. &
West, G. B. Urban scaling and its deviations: revealing the structure of wealth, innovation and crime across cities. _PLoS ONE_ 5, e13541 (2010). Article Google Scholar * van Raan, A. F.
J. German cities with universities: Socioeconomic position and university performance. _Quant. Sci. Stud._ 3, 265–288 (2022). Article Google Scholar * Webster, C. Coupling planning models
with models of spontaneous order. _Environ. Plan B Urban Anal. City Sci._ 51, 1051–1054 (2024). Article Google Scholar * Wan, G., Zhu, D., Wang, C. & Zhang, X. The size distribution of
cities in China: evolution of urban system and deviations from Zipf’s law. _Ecol. Indic._ 111, 106003 (2020). Article Google Scholar * González-Val, R. Deviations from Zipf’s Law for
American cities: an empirical examinations. _Urban Stud._ 48, 1017–1035 (2011). Article Google Scholar * Luckstead, J. & Devadoss, S. Do the world’s largest cities follow Zipf’s and
Gibrat’s laws? _Econ. Lett._ 125, 182–186 (2014). Article Google Scholar * Düben, C. & Krause, M. Population, light, and the size distribution of cities. _J. Reg. Sci._ 61, 189–211
(2021). Article Google Scholar * Levy, M. Gibrat’s law for (all) cities: comment. _Am. Econ. Rev._ 99, 1672–1675 (2009). Article Google Scholar * Eeckhout, J. Gibrat’s law for (all)
cities. _Am. Econ. Rev._ 94, 1429–1451 (2004). Article Google Scholar * Bergs, R. The detection of natural cities in the Netherlands—nocturnal satellite imagery and Zipf’s law. _Rev. Reg.
Res._ 38, 111–140 (2018). Article Google Scholar * Fluschnik, T. et al. The size distribution, scaling properties and spatial organization of urban clusters: a global and regional
percolation perspective. _ISPRS Int. J. Geoinf._ 5, 110 (2016). Article Google Scholar * Hubert, M. & Vandervieren, E. An adjusted boxplot for skewed distributions. _Comput. Stat. Data
Anal._ 52, 5186–5201 (2008). Article Google Scholar * Sarkar, S. Urban scaling and the geographic concentration of inequalities by city size. _Environ. Plan B Urban Anal. City Sci._ 46,
1627–1644 (2018). Article Google Scholar * Bergs, R. Spatial dependence in the rank-size distribution of cities – weak but not negligible. _PLoS ONE_ 16, e0246796 (2021). Article CAS
Google Scholar * Altmann, E. G. Spatial interactions in urban scaling laws. _PLoS ONE_ 15, e0243390 (2020). Article CAS Google Scholar * Borbon-Galvez, Y., Curi, S., Dallari, F. &
Ghiringhelli, G. International industrial symbiosis: Cross-border management of aggregates and construction and demolition waste between Italy and Switzerland. _Sustain. Prod. Consum._ 25,
312–324 (2021). Article Google Scholar * Colvero, D. A., Ramalho, J., Gomes, A. P. D., Matos, M. A. A. & Tarelho, L. A. D. C. Economic analysis of a shared municipal solid waste
management facility in a metropolitan region. _Waste Manag._ 102, 823–837 (2020). Article Google Scholar Download references ACKNOWLEDGEMENTS This work was supported by National Natural
Science Foundation of China (72304072) and the PDF funding from Faculty of Architecture, The University of Hong Kong. The work described in this paper was conducted in part by Dr. Chen CHEN,
Jockey Club Global STEM Post-doctoral Fellow supported by The Hong Kong Jockey Club Charities Trust. AUTHOR INFORMATION AUTHORS AND AFFILIATIONS * Department of Urban Planning and Design,
The University of Hong Kong, Hong Kong, China Chen Chen, Xiaohu Zhang & Chris Webster * School of Geography and Remote Sensing, Guangzhou University, Guangzhou, Guangdong, China Chen
Chen * Urban Systems Institute, The University of Hong Kong, Hong Kong, China Xiaohu Zhang & Chris Webster Authors * Chen Chen View author publications You can also search for this
author inPubMed Google Scholar * Xiaohu Zhang View author publications You can also search for this author inPubMed Google Scholar * Chris Webster View author publications You can also
search for this author inPubMed Google Scholar CONTRIBUTIONS Z.X. and C.C. co-designed the research. C.C. collected the data and performed the quantitative analysis. W.C. and Z.X. supervised
the work and provided guidance. C.C. wrote the original manuscript. W.C., Z.X., and C.C. revised the manuscript. All authors engaged in the discussion and contributed significantly to this
work. CORRESPONDING AUTHOR Correspondence to Xiaohu Zhang. ETHICS DECLARATIONS COMPETING INTERESTS The authors declare no competing interests. ADDITIONAL INFORMATION PUBLISHER’S NOTE
Springer Nature remains neutral with regard to jurisdictional claims in published maps and institutional affiliations. SUPPLEMENTARY INFORMATION SUPPLEMENTARY INFORMATION RIGHTS AND
PERMISSIONS OPEN ACCESS This article is licensed under a Creative Commons Attribution-NonCommercial-NoDerivatives 4.0 International License, which permits any non-commercial use, sharing,
distribution and reproduction in any medium or format, as long as you give appropriate credit to the original author(s) and the source, provide a link to the Creative Commons licence, and
indicate if you modified the licensed material. You do not have permission under this licence to share adapted material derived from this article or parts of it. The images or other third
party material in this article are included in the article’s Creative Commons licence, unless indicated otherwise in a credit line to the material. If material is not included in the
article’s Creative Commons licence and your intended use is not permitted by statutory regulation or exceeds the permitted use, you will need to obtain permission directly from the copyright
holder. To view a copy of this licence, visit http://creativecommons.org/licenses/by-nc-nd/4.0/. Reprints and permissions ABOUT THIS ARTICLE CITE THIS ARTICLE Chen, C., Zhang, X. &
Webster, C. Truncation in the scaling of urban pollution control. _npj Urban Sustain_ 5, 9 (2025). https://doi.org/10.1038/s42949-025-00197-w Download citation * Received: 18 October 2024 *
Accepted: 10 March 2025 * Published: 01 April 2025 * DOI: https://doi.org/10.1038/s42949-025-00197-w SHARE THIS ARTICLE Anyone you share the following link with will be able to read this
content: Get shareable link Sorry, a shareable link is not currently available for this article. Copy to clipboard Provided by the Springer Nature SharedIt content-sharing initiative