Numerical indices based on circulating tumor DNA for the evaluation of therapeutic response and disease progression in lung cancer patients
- Select a language for the TTS:
- UK English Female
- UK English Male
- US English Female
- US English Male
- Australian Female
- Australian Male
- Language selected: (auto detect) - EN
Play all audios:

Monitoring of disease/therapeutic conditions is an important application of circulating tumor DNA (ctDNA). We devised numerical indices, based on ctDNA dynamics, for therapeutic response and
disease progression. 52 lung cancer patients subjected to the EGFR-TKI treatment were prospectively collected and ctDNA levels represented by the activating and T790M mutations were
measured using deep sequencing. Typically, ctDNA levels decreased sharply upon initiation of EGFR-TKI, however this did not occur in progressive disease (PD) cases. All 3 PD cases at
initiation of EGFR-TKI were separated from other 27 cases in a two-dimensional space generated by the ratio of the ctDNA levels before and after therapy initiation (mutation allele ratio in
therapy, MART) and the average ctDNA level. For responses to various agents after disease progression, PD/stable disease cases were separated from partial response cases using MART
(accuracy, 94.7%; 95% CI, 73.5–100). For disease progression, the initiation of ctDNA elevation (initial positive point) was compared with the onset of objective disease progression. In 11
out of 28 eligible patients, both occurred within ±100 day range, suggesting a detection of the same change in disease condition. Our numerical indices have potential applicability in
clinical practice, pending confirmation with designed prospective studies.
Circulating tumor DNA (ctDNA) is the cell-free DNA released from dying cancer cells1 and represents an emerging field of cancer research. Because ctDNA appears more frequently in advanced
cancers than in early cancers2 and its level is generally considered to correlate with the tumor burden, monitoring of disease/therapeutic conditions is regarded as the foremost application
of ctDNA3. Usually, cancer-related mutations are identified in primary lesions and these serve as markers to detect ctDNA. Therapy-resistant mutations of target genes were identified with
several agents and these may be used to monitor acquired resistance4,5,6,7,8.
In the case of advanced non-small cell lung cancer, ctDNA has been extensively explored for genotyping of EGFR. Due to a strong correlation between EGFR activating mutations and the efficacy
of EGFR tyrosine kinase inhibitors (EGFR-TKIs)9,10, the detection of mutations is indispensable for therapeutic decision making. Introduction of the next-generation EGFR-TKIs11,12 targeting
EGFR with the T790M13 resistant mutation necessitates the genotyping of the T790M locus. ctDNA containing EGFR-activating mutations and that containing the T790M mutation can serve as a
metric for all cancer cells and therapy-resistant cells, respectively. ctDNA analysis in the EGFR-TKI treatment is advantageous over that in treatments using the other agents, which requires
the identification of marker mutations to follow the whole amount of ctDNA.
Observation of ctDNA dynamics is often subjective. To enable the objective evaluation of ctDNA dynamics, it is desirable to have simple numerical indices that summarize information of
individual events. Such indices could be directly used in clinical practice once their utility is established. In the case of advanced cancer, evaluation of therapeutic responses and disease
progression is important from a clinical viewpoint. In addition, the comparison should be performed with data obtained from an unbiased patient population, simulating real clinical
practice.
We constructed a detection system for EGFR mutations in ctDNA using deep sequencing with a massively parallel DNA sequencer5. This system is among the most intensively validated assay
systems for ctDNA14. Using this system, we conducted a prospective exploratory study to follow temporal changes of ctDNA levels under a real clinical setting. The general features of the
data were previously described15. In this report, we propose two numerical indices to extract relevant information from ctDNA dynamics for clinically important events. These are a numerical
index for the evaluation of the therapeutic response and an index to estimate the onset of disease progression. The performance of these indices was evaluated using the current standards,
namely the Response Evaluation Criteria In Solid Tumors (RECIST)16. We demonstrate that these indices, particularly the therapeutic response index, appear to be useful for studying ctDNA
dynamics and should be further investigated with designed prospective studies.
In total, 52 patients participated in the study. The clinical characteristics of this patient population are shown in Table 1. Patient information corresponds to the initiation of the
EGFR-TKI treatment. The total number of blood samples was 530. The initial PCR amplification of EGFR exon fragments was successful in all the samples and mutation data were obtained from all
the samples.
We examined whether ctDNA dynamics could be used to evaluate the effect of EGFR-TKI treatment. As 5 patients lacked samples of the corresponding time points, 47 patients were eligible for
the analysis. Thirty patients (63.8%), whose initial levels of ctDNA exceeded the threshold, were forwarded to the following quantitative analysis. Clinical characteristics of this patient
subpopulation are shown in Table 1.
Mutation allele ratio in therapy (MART) is defined as the ratio of the PM score of the activating mutation after the initiation of therapy to that before the therapy and is used as an index
for therapeutic response. In the most cases, the initial high ctDNA levels decreased rapidly during the 2 weeks after the initiation of EGFR-TKI, but some cases continued to decrease until 4
weeks. For the calculation of MART, PM scores of 2 weeks and 4 weeks were used for 23 and 7 cases, respectively. MART is plotted in Supplementary Figure S1a, grouping the patients into PD
and PR/complete response (CR)/SD/not evaluable (NE) cases. MART of all three PD cases exceeded 0.1. On the contrary, MART exceeded 0.1 in only 6 out of 27 PR/CR/SD/NE cases. PM scores of
these 9 cases are plotted in Supplementary Figure 1b. PM scores of PD cases were significantly higher than those of PR/CR cases. In the case of low ctDNA levels, the number of molecules in
blood samples may fluctuate among sampling events, leading to fluctuations in PM scores. We therefore used the average of PM scores of the two assays as a second parameter to assess the
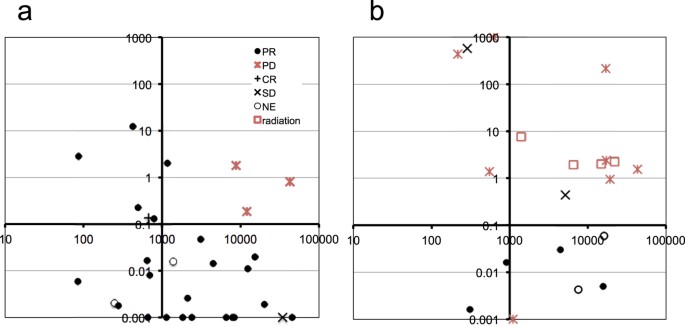
reliability of MART. In a two-dimensional space generated by MART and PM scores, PD cases segregated in the upper right part of the plot (Fig. 1a).
Quantitative changes of ctDNA levels during therapeutic changes.
Vertical axis, mutation allele ratio in therapy (MART). Horizontal axis, average of PM scores before and after initiation of therapies. (a) Response to the initial EGFR-TKI treatment. (b)
Response to various therapies after the first disease progression. MART > 1000 and